
| Structural Business Statistics - Industry, Distribution and Services, 2015 - 2017 | |||||||
| Percentage change | |||||||
| 2015 | 2016 | 2017 | 2016 - 2017 | 2015 - 2017 | |||
| Enterprises | No. | 209,721 | 210,636 | 225,989 | 7.3 | 7.8 | |
| Persons Engaged | No. | 1,259,480 | 1,324,084 | 1,384,943 | 4.6 | 10.0 | |
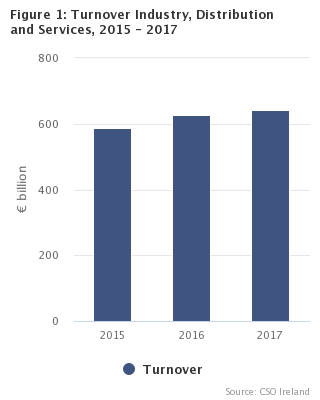
| Turnover | €m | 585,768 | 625,547 | 642,830 | 2.8 | 9.7 | |
| Gross Value Added | €m | 176,133 | 183,974 | 201,030 | 9.3 | 14.1 | |
| Includes all Industrial, Distribution and Services enterprises in Ireland, excludes the Construction sector. | |||||||
This release provides details of the individual surveys in the Structural Business Economy i.e. Census of Industrial Production and Annual Services Inquiry. It also analyses these sectors by size class of enterprise and nationality of ownership.
| Note: This release relates to Industry, Distribution and Services sectors. Data for the Construction sector to follow. Figures 8 & 9 have been revised to reflect changes made in Irish and Foreign enterprises. |
| Table 1 Industry | ||||||
| Percentage change | ||||||
| 2015 | 2016 | 2017 | 2016 - 2017 | |||
| Enterprises | No. | 17,176 | 17,555 | 18,817 | 7.2 | |
| of which; SME (<250) | 17,010 | 17,380 | 18,639 | 7.2 | ||
| Large (250+) | 166 | 175 | 178 | 1.7 | ||
| Persons Engaged | No. | 221,797 | 235,352 | 242,966 | 3.2 | |
| of which; SME (<250) | 118,376 | 121,921 | 125,596 | 3.0 | ||
| Large (250+) | 103,421 | 113,431 | 117,370 | 3.5 | ||
| Turnover | €m | 233,804 | 227,154 | 238,601 | 5.0 | |
| of which; SME (<250) | 40,892 | 41,570 | 44,328 | 6.6 | ||
| Large (250+) | 192,913 | 185,583 | 194,273 | 4.7 | ||
| Gross Value Added | €m | 95,025 | 93,264 | 103,029 | 10.5 | |
| of which; SME (<250) | 13,629 | 15,017 | 15,045 | 0.2 | ||
| Large (250+) | 81,395 | 78,247 | 87,984 | 12.4 | ||
Persons engaged in Industrial sector up 3.2% in 2017
| Turnover | Gross Value Added | |
| 2015 | 233.804 | 95.025 |
| 2016 | 227.154 | 93.264 |
| 2017 | 238.601 | 103.029 |
| Large (250+ persons) | SME (<250 persons) | |
| 2015 | 103421 | 118376 |
| 2016 | 113431 | 121921 |
| 2017 | 117370 | 125596 |
| Large (250+ persons) | SME (<250 persons) | |
| 2015 | 81.395 | 13.629 |
| 2016 | 78.247 | 15.017 |
| 2017 | 87.984 | 15.045 |
| Table 2 Distribution and Services | ||||||
| Percentage change | ||||||
| 2015 | 2016 | 2017 | 2016 - 2017 | |||
| Enterprises | No. | 192,545 | 193,081 | 207,172 | 7.3 | |
| of which; SME (<250) | 192,234 | 192,739 | 206,809 | 7.3 | ||
| Large (250+) | 311 | 342 | 363 | 6.1 | ||
| Persons Engaged | No. | 1,037,683 | 1,088,732 | 1,141,977 | 4.9 | |
| of which; SME (<250) | 768,550 | 798,256 | 833,843 | 4.5 | ||
| Large (250+) | 269,133 | 290,476 | 308,134 | 6.1 | ||
| Turnover | €m | 351,964 | 398,393 | 404,229 | 1.5 | |
| of which; SME (<250) | 232,606 | 264,833 | 268,336 | 1.3 | ||
| Large (250+) | 119,358 | 133,559 | 135,893 | 1.7 | ||
| Gross Value Added | €m | 81,108 | 90,710 | 98,001 | 8.0 | |
| of which; SME (<250) | 52,380 | 58,330 | 57,970 | -0.6 | ||
| Large (250+) | 28,728 | 32,380 | 40,032 | 23.6 | ||
The number of enterprises in Distribution and Services sectors increased by 7.3% in 2017
| Turnover | Gross Value Added | |
| 2015 | 351.964 | 81.108 |
| 2016 | 398.393 | 90.71 |
| 2017 | 404.229 | 98.001 |
| Large (250+ persons) | SME (<250 persons) | |
| 2015 | 269133 | 768550 |
| 2016 | 290476 | 798256 |
| 2017 | 308134 | 833843 |
| Large (250+ persons) | SME (<250 persons) | |
| 2015 | 28.728 | 52.38 |
| 2016 | 32.38 | 58.33 |
| 2017 | 40.032 | 57.97 |
| Large (250+ persons) | SME (<250 persons) | |
| Industry - Irish | 30.1 | 69.9 |
| Industry - Foreign | 75.2 | 24.8 |
| Distribution and Services - Irish | 17.1 | 82.9 |
| Distribution and Services - Foreign | 67.6 | 32.4 |
| Large (250+ persons) | SME (<250 persons) | |
| Industry - Irish | 48.5 | 51.5 |
| Industry - Foreign | 91.4 | 8.6 |
| Distribution and Services - Irish | 22.4 | 77.6 |
| Distribution and Services - Foreign | 66.7 | 33.3 |
The background notes and detailed methodology for the surveys used to compile the The Structural Business Statistics release can be found as follows:
Census of Industrial Production
 Hide Background Notes
Scan the QR code below to view this release online or go to
http://www.cso.ie/en/releasesandpublications/er/sbs/structuralbusinessstatistics2017/
 Show Table 1 Industry
 Hide Table 1 Industry