
| Structural Business Statistics, 2014 - 2016 | ||||||
| Percentage change | ||||||
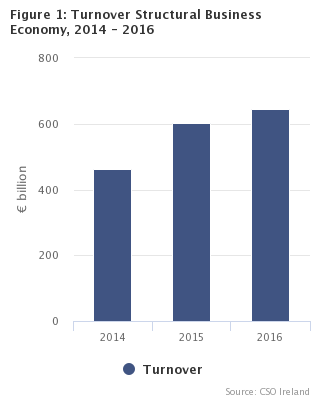
| 2014 | 2015 | 2016 | 2015 -2016 | 2014 -2016 | ||
| Enterprises | No. | 249,377 | 260,267 | 262,204 | 0.7 | 5.1 |
| Persons Engaged | No. | 1,299,636 | 1,368,200 | 1,444,425 | 5.6 | 11.1 |
| Turnover | €m | 460,555 | 600,7131 | 644,975 | 7.4 | 40.0 |
| Gross Value Added | €m | 121,894 | 181,9521 | 190,934 | 4.9 | 56.6 |
| Structural Business Statistics include all Industrial, Services & Distribution and Construction enterprises in Ireland. | ||||||
| 1Revised. | ||||||
This release provides details of the individual surveys in the Structural Business Economy i.e. Census of Industrial Production, Annual Services Inquiry and the Building & Construction Inquiry. It will also analyse these sectors by size class of enterprise and nationality of ownership.
| Table 1 Industry | ||||||
| Percentage change | ||||||
| 2014 | 2015 | 2016 | 2015 - 2016 | |||
| Enterprises | No. | 16,497 | 17,176 | 17,555 | 2.2 | |
| of which; SME (<250) | 16,340 | 17,010 | 17,380 | 2.2 | ||
| Large (250+) | 157 | 166 | 175 | 5.4 | ||
| Persons Engaged | No. | 210,545 | 221,797 | 235,352 | 6.1 | |
| of which; SME (<250) | 114,642 | 118,376 | 121,921 | 3.0 | ||
| Large (250+) | 95,903 | 103,421 | 113,431 | 9.7 | ||
| Turnover | €m | 127,366 | 233,804 | 227,154 | -2.8 | |
| of which; SME (<250) | 39,772 | 40,892 | 41,570 | 1.7 | ||
| Large (250+) | 87,595 | 192,913 | 185,583 | -3.8 | ||
| Gross Value Added | €m | 42,920 | 95,025 | 93,264 | -1.9 | |
| of which; SME (<250) | 12,561 | 13,629 | 15,017 | 10.2 | ||
| Large (250+) | 30,359 | 81,395 | 78,247 | -3.9 | ||
Persons engaged in Industrial sector up 6.1% in 2016
| Turnover | Gross Value Added | |
| 2014 | 127.366 | 42.92 |
| 2015 | 233.804 | 95.025 |
| 2016 | 227.154 | 93.264 |
| Large (250+ persons) | SME (<250 persons) | |
| 2014 | 95903 | 114642 |
| 2015 | 103421 | 118376 |
| 2016 | 113431 | 121921 |
| Large (250+ persons) | SME (<250 persons) | |
| 2014 | 30.359 | 12.561 |
| 2015 | 81.395 | 13.629 |
| 2016 | 78.247 | 15.017 |
| Table 2 Services and Distribution | ||||||||
| Percentage change | ||||||||
| 2014 | 2015 | 2016 | 2015 - 2016 | |||||
| Enterprises | No. | 185,531 | 192,545 | 193,081 | 0.3 | |||
| of which; SME (<250) | 185,245 | 192,234 | 192,739 | 0.3 | ||||
| Large (250+) | 286 | 311 | 342 | 10.0 | ||||
| Persons Engaged | No. | 989,231 | 1,037,683 | 1,088,732 | 4.9 | |||
| of which; SME (<250) | 734,865 | 768,550 | 798,256 | 3.9 | ||||
| Large (250+) | 254,366 | 269,133 | 290,476 | 7.9 | ||||
| Turnover | €m | 318,981 | 351,964 | 398,393 | 13.2 | |||
| of which; SME (<250) | 205,655 | 232,606 | 264,833 | 13.9 | ||||
| Large (250+) | 113,326 | 119,358 | 133,559 | 11.9 | ||||
| Gross Value Added | €m | 73,354 | 81,108 | 90,710 | 11.8 | |||
| of which; SME (<250) | 43,230 | 52,380 | 58,330 | 11.4 | ||||
| Large (250+) | 30,124 | 28,728 | 32,380 | 12.7 | ||||
Turnover in Services and Distribution sectors increased by over 13% in 2016
| Turnover | Gross Value Added | |
| 2014 | 318.981 | 73.354 |
| 2015 | 351.964 | 81.108 |
| 2016 | 398.393 | 90.71 |
| Large (250+ persons) | SME (<250 persons) | |
| 2014 | 254366 | 734865 |
| 2015 | 269133 | 768550 |
| 2016 | 290476 | 798256 |
| Large (250+ persons) | SME (<250 persons) | |
| 2014 | 30.124 | 43.23 |
| 2015 | 28.728 | 52.38 |
| 2016 | 32.38 | 58.33 |
| Table 3 Building and Construction | ||||||
| Percentage change | ||||||
| 2014 | 2015 | 2016 | 2015 - 2016 | |||
| Enterprises | No. | 47,349 | 50,546 | 51,568 | 2.0 | |
| of which; SME (<250) | 47,333 | 50,533 | 51,554 | 2.0 | ||
| Large (250+) | 16 | 13 | 14 | 7.7 | ||
| Persons Engaged | No. | 99,860 | 108,720 | 120,341 | 10.7 | |
| of which; SME (<250) | 92,289 | 102,690 | 113,558 | 10.6 | ||
| Large (250+) | 7,571 | 6,030 | 6,783 | 12.5 | ||
| Turnover | €m | 14,208 | 14,9451 | 19,428 | 30.0 | |
| of which; SME (<250) | 13,090 | 13,443 | 17,395 | 29.4 | ||
| Large (250+) | 1,118 | 1,502 | 2,033 | 35.4 | ||
| Gross Value Added | €m | 5,620 | 5,8191 | 6,960 | 19.6 | |
| of which; SME (<250) | 5,141 | 5,296 | 6,296 | 18.9 | ||
| Large (250+) | 479 | 523 | 664 | 27.0 | ||
| 1Revised. | ||||||
Construction turnover shows an annual increase 30%
| Turnover | Gross Value Added | |
| 2014 | 14.208 | 5.62 |
| 2015 | 14.945 | 5.819 |
| 2016 | 19.428 | 6.96 |
| Large (250+ persons) | SME (<250 persons) | |
| 2014 | 7571 | 92289 |
| 2015 | 6030 | 102690 |
| 2016 | 6783 | 113558 |
| Large (250+ persons) | SME (<250 persons) | |
| 2014 | 0.479 | 5.141 |
| 2015 | 0.523 | 5.296 |
| 2016 | 0.664 | 6.296 |
| Large (250+ persons) | SME (<250 persons) | |
| Industry - Irish | 33.6 | 66.4 |
| Industry - Foreign | 74.4 | 25.6 |
| Building and Construction - Irish | 3.9 | 96.1 |
| Building and Construction - Foreign* | 0 | 0 |
| Services and Distribution - Irish | 17 | 83 |
| Services and Distribution - Foreign | 68.5 | 31.5 |
| Large (250+ persons) | SME (<250 persons) | |
| Industry - Irish | 49.2 | 50.8 |
| Industry - Foreign | 90 | 10 |
| Building and Construction - Irish | 5.6 | 94.4 |
| Building and Construction - Foreign* | 0 | 0 |
| Services and Distribution - Irish | 16.4 | 83.6 |
| Services and Distribution - Foreign | 70 | 30 |
The background notes and detailed methodology for the three individual surveys used to compile the The Structural Business Statistics release can be found as follows:
Census of Industrial Production
Building & Construction Inquiry
 Hide Background Notes
Scan the QR code below to view this release online or go to
http://www.cso.ie/en/releasesandpublications/er/sbs/structuralbusinessstatistics2016/
 Show Table 1 Industry
 Hide Table 1 Industry