
| Type of Innovation expenditure by enterprises1 2008, 2010 and 2012 (€m) | |||||||
| Percentage change | |||||||
| 2008 | 2010 | 2012 | 2008 - 2012 | 2010 - 2012 | |||
| In-house Research and Development | 1,608.7 | 1,252.9 | 1,861.4 | 15.7 | 48.6 | ||
| Purchase of external Research and Development | 492.6 | 481.7 | 525.3 | 6.6 | 9.0 | ||
| Acquisition of machinery, equipment and software | 2,863.7 | 603.9 | 921.7 | -67.8 | 52.6 | ||
| Acquisition of other external knowledge | 314.9 | 206.6 | 236.8 | -24.8 | 14.6 | ||
| All other innovation activities | n/a | n/a | 109.1 | n/a | n/a | ||
| Total innovation expenditure | 5,279.9 | 2,545.1 | 3,654.2 | -30.8 | 43.6 | ||
| 1 Enterprises with 10 or more employed in Industry and selected Services sectors. See background notes for more information. | |||||||
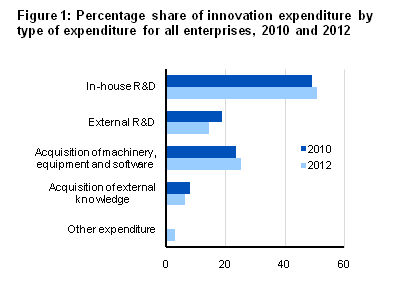
Results from the 2010 - 2012 Community Innovation Survey show that total spending on innovation activities in industry and selected services sectors was in excess of €3.6bn in 2012, a substantial increase on the 2010 spend of €2.5bn. The main driver for this increase was the increase in the spend on in-house Research & Development (R&D), from €1.25bn in 2010 to €1.86bn in 2012 and the increase in the expenditure on acquistion of machinery from €603m to €922m. The value of purchases of external R&D in 2012 was €525m which accounted for 14% of expenditure, while the acquisition of external knowledge at €237m represented 6%. The value of all other innovation activities,€109m, accounted for 3% of all expenditure.
Please note that increased coverage in the Services sector for reference year 2012, primarily relating to Professional, Scientific and Technical activities has also contributed to this increase in expenditure (albeit only €200m of the increase can be attributed to the increased coverage). The spend on innovation activities represents about 1.5% of all expenditure in the Industry and Services sector as measured by the 2012 Census of Industrial Production and Annual Services Inquiry. Care should therefore be taken in interpreting the results from the Community Innovation Survey as the level of spend can experience volatility given the relative low level of spend on innovation by enterprises. See Figure 1 and Headline table.
Services enterprises spend on in-house R&D accounted for over 30% of total expenditure
The total spend of €3.6bn by enterprises on innovation activities was split evenly between the industrial and selected services sectors, at €1.8bn each. Industrial enterprises spent €742m on in-house R&D, €545m on machinery, equipment and software, €367m on external R&D and €141m on acquisition of external knowledge, while €48m was spent on all other innovation activities. The selected services sector enterprises spent €1.1bn on in-house R&D, €376m on machinery and equipment, €158m on external R&D, €96m on acquisition of external knowledge and €61m spent on all other innovation activities. See Table 1.

Foreign enterprises account for almost 63% of total innovation expenditure
Irish owned enterprises, which account for 79% of all relevant enterprises, spent €1.36bn on innovation related activities in 2012, of which €592m was spent on in-house R&D. Even though foreign owned enterprises only accounted for 21% of all enterprises, they spent €2.3bn, or 63% of all innovation-related expenditure including €1.3 bn on in-house R&D. See Figure 2 and Table 1.
Over one in three , or 36% of, enterprises had innovation expenditure in 2012. More than 31% of all small enterprises, 52% of medium sized enterprises and 68% of large enterprises had such expenditure in the period. The largest 50 enterprises with innovation expenditure, who represent less than 1% of all relevant enterprises, accounted for 60% of total innovation expenditure. See Table 2.
48% of industrial enterprises had innovation expenditure compared with 30% of enterprises in selected services sectors. While 34% of enterprises in the industrial sector purchased machinery, equipment or software related to innovation activities the corresponding figure selected services sector enterprises was 19%. See Figure 3 and Table 2.
| Industry | Selected Services | |
| In-house R&D | 38.719512195122 | 21.2958867757629 |
| External R&D | 17.3344947735192 | 10.9243697478992 |
| Acquisition of machinery, equipment and software | 34.0156794425087 | 19.4161875276426 |
| Acquisition of external knowledge | 12.7177700348432 | 9.99557717823972 |
| All other innovation activities | 24.9564459930314 | 16.8067226890756 |
Almost 34% of Irish owned enterprises had innovation related expenditure in the reference period compared to 46% of foreign owned enterprises. Almost 26% of Irish owned enterprises purchased in-house R&D related to innovation activities compared to 33% of foreign owned enterprises. See Figure 4 and Table 2.
| Irish Owned | Foreign Owned | |
| In-house R&D | 25.5636295882243 | 33.0806340454859 |
| External R&D | 11.6825041922862 | 18.1943487250172 |
| Acquisition of machinery, equipment and software | 23.0482578721818 | 29.1523087525844 |
| Acquisition of external knowledge | 10.2105459288243 | 13.5079255685734 |
| All other innovation activities | 18.1665735047513 | 24.6037215713301 |
Almost 59% of all enterprises were innovation active during 2010-2012
Almost 59% of enterprises with 10 or more persons engaged in the industrial and selected services sectors were innovation active over the period 2010-2012. These enterprises generated 84% of total turnover in these sectors. Over three-quarters of total persons engaged in these sectors worked in such enterprises.
Enterprises that are classed as innovation active are those enterprises that have carried out a product innovation or a process innovation or an organisational or a marketing innovation between 2010 and 2012. See Table 3 and Figure 5.
| Total Industry | Total Selected Services | All innovative active enterprises | |
| Total enterprises with innovation activities | 66.2020905923345 | 54.953560371517 | 58.7415664417718 |
| Total turnover that is generated by enterprises with innovation activities | 90.3921255148226 | 80.9522673809553 | 83.9970946397326 |
| Total persons engaged who work in enterprises with innovation activities | 82.5777423396742 | 74.6377559188175 | 77.6904801007281 |
Over 42% of all enterprises were technological innovation active during 2010-2012
Enterprises that are classed as technological innovation active are those enterprises that had carried out a product innovation or a process innovation in the survey period.
Overall, it was found that 42% of all enterprises with ten or more persons engaged in the industrial and selected services sectors were technologically innovation active in the reference period. These enterprises generated 70% of all turnover and employed 64% of persons engaged in the industrial and selected services sector. See Figure 6.

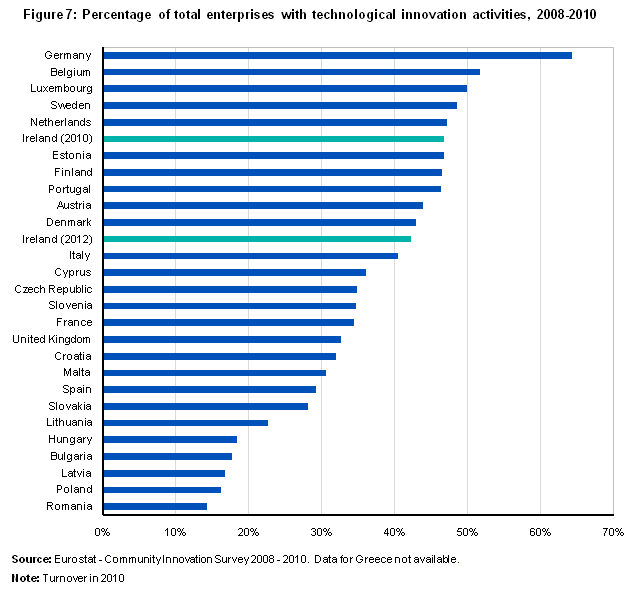
The Community Innovation Survey is carried out in all EU member states. The most recent data available from Eurostat is taken from the 2008-2010 survey, and allows comparisons across the entire community. When analysing results, Ireland shows the 6th highest innovation rates of all countries for whom data has been published.
While the innovation activity rate for enterprises in industry and selected services sectors with at least ten persons engaged was 42% in Ireland in the period 2010-2012, comparable innovation activity rates will not be available for the other EU member states until Q4 2014. See Figure 7.
Ireland had the 7th highest innovation spend per enterprise on in-house R&D at €851,000 for the period 2008 - 2010 with Denmark having the highest spend per enterprises at €2.65m. Comparable figures for 2010-2012 show the spend per enterprise in Ireland has risen to over €1m per enterprise. See Figure 8.

Over one in four enterprises in the industrial and selected services sectors had product innovations while almost 26% were engaged in process innovations. Just over one in six ,17%, of those enterprises were engaged in both process and product innovations. Almost 33% of industrial enterprises were engaged in process innovation compared to nearly 23% of enterprises in selected services sectors. Foreign owned enterprises were more likely to engage in product innovations, process innovations or both product and process innovations compared to Irish owned enterprises. See Figure 9.
| Product innovation | Process innovation | Product and process innovation | |
| Industry | 33.79 | 32.5 | 21.34 |
| Services | 24.7 | 22.46 | 14.15 |
| Irish owned | 24.42 | 23.32 | 14.4 |
| Foreign owned | 40.17 | 35.28 | 24.53 |
| All enterprises | 27.8 | 25.9 | 16.6 |
Of the 23% of turnover reported in 2012, almost 16% of turnover for enterprises in 2012 was reported to be the result of new to the market product innovations in the reference year, while 8% of turnover was as a result of new to the firm product innovations in the same period.
Over 27% of the turnover of foreign owned enterprises was generated as a result of new to the market and new to firm product innovations compared to nearly 17% of the turnover of Irish owned enterprises. See Figure 10.
| Turnover : New to firm | Turnover: New to market | |
| Industry | 2.39186607969405 | 12.1493836982169 |
| Services | 10.4776448600409 | 17.2535648250311 |
| Irish owned | 7.13776175583258 | 9.61010416990642 |
| Foreign owned | 8.30163472431016 | 19.1478701835805 |
| All enterprises | 7.86957573343559 | 15.6072106523023 |
73% of large enterprises introduced an organisational innovation
Enterprises were asked details of organisational innovations that they introduced in the period 2010-2012. An organisational innovation is a new organisational method in the enterprise’s business practices, workplace organisation or external relations that had not been previously used by enterprises.
Over 42% of all enterprises carried out an organisational innovation between 2010 and 2012. The introduction of new business practices ,33%, and new methods of organising work responsibilities and decision-making ,36%, were the most cited forms of organisational innovation. An organisational innovation was introduced by nearly three in four large enterprises over the survey period. This compares with 38% of small enterprises and 55% of medium sized enterprises. See Figure 11.
| Small (10-49) | Medium (50-249) | Large (250+) | |
| New business practices | 29.0118870728083 | 45.9342560553633 | 66.5467625899281 |
| New methods of organising work responsibilities and decision-making | 32.3179791976226 | 45.5017301038062 | 64.7482014388489 |
| New methods of organising external relations | 15.9175334323923 | 24.3944636678201 | 39.568345323741 |
| Any organisational innovation | 37.982912332838 | 55.1038062283737 | 73.0215827338129 |
Enterprises indicate that their primary marketing innovation was the introduction of new media or techniques for product promotion
Over one in three of all enterprises ,35%, carried out a marketing innovation between 2010 and 2012. The most common form of marketing innovation was the introduction of new media or techniques for product promotion and one-quarter of all enterprises indicated that they engaged in this activity. 18% of all enterprises introduced significant changes to the aesthetic design or packaging of a good or service. A marketing innovation was introduced by 42% of medium sized enterprises and 51% of large enterprises between 2010 and 2012 while 33% of small enterprises introduced a marketing innovation. See Figure 12.
38% of industrial enterprises had a marketing innovation which compared to 35% of enterprises in the selected services sector. 40% of foreign owned enterprises introduced a marketing innovation in the period 2010-2012 compared to over one in three ,35%, Irish owned enterprises. 26% of foreign owned enterprises introduced new media or techniques for product promotion compared to 24% of Irish owned enterprises. Almost a quarter ,23%, of foreign owned enterprises introduced significant changes to the aesthetic design or packaging of a good or service compared to 16% of Irish enterprises.
| 10-49 persons engaged | 50-249 persons engaged | 250+ persons engaged | |
| Significant changes to the aesthetic design or packaging of a good or service | 15.5089153046062 | 25.1730103806228 | 30.9352517985612 |
| New media techniques for product promotion | 22.5668647845468 | 28.0276816608997 | 37.0503597122302 |
| New methods for product placement or sales channels | 13.3729569093611 | 21.7128027681661 | 26.6187050359712 |
| New methods of pricing goods or services | 15.3417533432392 | 19.1176470588235 | 25.5395683453237 |
| Any marketing innovation | 33.4323922734027 | 42.6470588235294 | 51.4388489208633 |
Innovation co-operation with enterprises in the United States sees a large increase
In developing new to market or new to firm product and process innovations, firms can develop these within their own firm or within their enterprise group. Alternatively, firms may engage in innovation co-operation with other sources to help develop these innovations.
31% of all innovation active enterprises indicated that they engaged in some co-operative activity when developing their innovations. 23% of all enterprises were engaged in innovation co-operation with partners that were located in Ireland, compared with 20% of enterprises that were engaged with partners in the Rest of Europe. Compared with the 2008-2010 survey, innovation co-operation with enterprises located in the United States increased from 7% of all enterprises to 11% of all enterprises. See Figure 13.
Over one in four industrial enterprises and one in five selected services sector enterprises engaged in innovation co-operation with innovation partners that were located in Ireland. In excess of 21% of industrial enterprises were engaged in innovation co-operation with partners in the Rest of Europe compared to over 17% of selected services sector enterprises.
Around one in five Irish owned enterprises were engaged in innovation co-operation with enterprises located in Ireland while over 13% had innovation co-operation with partners located in the Rest of Europe. 35% of all foreign owned enterprises were engaged in innovation co-operation with enterprises located in the Rest of Europe while almost 27% co-operated with partners in Ireland.
Almost half ,49%, of large enterprises engaged in innovation co-operation with innovation partners located in Ireland while close to 9% of large enterprises co-operated with innovation partners located in China/India.
| All enterprises | |
| Ireland | 23.309053069719 |
| Northern Ireland | 5.1335414498786 |
| Rest of Europe | 19.5629552549428 |
| United States | 10.5445716267777 |
| China/India | 3.71141172389872 |
| All other countries | 3.95421436004162 |
| Table 1: Technological innovation expenditure by nationality of ownership, sector and size class, 2012 | ||||||||||||
| €m | ||||||||||||
| Nationality of ownership | Sector of activity | Size class | ||||||||||
| Irish | Foreign | Industry | Services | Small | Medium | Large | All enterprises | |||||
| (10-49) | (50-249) | (250+) | ||||||||||
| In-house R&D | 592.8 | 1,268.5 | 741.9 | 1,119.5 | 419.3 | 435.2 | 1,006.8 | 1,861.4 | ||||
| Purchase of External R&D | 248.5 | 276.8 | 366.7 | 158.6 | 79.0 | 102.2 | 344.1 | 525.3 | ||||
| Acquisition of machinery, equipment and software | 371.6 | 550.1 | 545.1 | 376.6 | 175.2 | 177.3 | 569.3 | 921.7 | ||||
| Acquisition of other external knowledge | 113.0 | 123.8 | 141.1 | 95.7 | 42.5 | 104.0 | 90.3 | 236.8 | ||||
| Other expenditure | 34.7 | 74.4 | 48.0 | 61.1 | 51.8 | 25.1 | 32.3 | 109.1 | ||||
| Total innovation expenditure | 1,360.6 | 2,293.6 | 1,842.7 | 1,811.5 | 767.7 | 843.8 | 2,042.7 | 3,654.2 | ||||
| Table 2: Percentage of enterprises engaged in technological innovation expenditure by nationality of ownership, sector and size class, 2012 | |||||||||||
| % | |||||||||||
| Nationality of ownership | Sector of activity | Size class | |||||||||
| Irish | Foreign | Industry | Services | Small | Medium | Large | All enterprises | ||||
| (10-49) | (50-249) | (250+) | |||||||||
| In-house R&D | 25.6 | 33.1 | 38.7 | 21.3 | 22.9 | 40.1 | 55.8 | 27.2 | |||
| Purchase of external R&D | 11.7 | 18.2 | 17.3 | 10.9 | 10.7 | 20.2 | 30.2 | 13.1 | |||
| Acquisition of machinery, equipment & software | 23.0 | 29.2 | 34.0 | 19.4 | 20.4 | 37.3 | 46.8 | 24.3 | |||
| Acquisition of other external knowledge | 10.2 | 13.5 | 12.7 | 10.0 | 9.2 | 17.3 | 17.6 | 10.9 | |||
| Active - all other expenditure | 18.2 | 24.6 | 25.0 | 16.8 | 16.5 | 30.3 | 33.5 | 19.5 | |||
| Total | 33.9 | 45.6 | 48.2 | 30.4 | 31.5 | 51.6 | 67.6 | 36.4 | |||
| Table 3: Technological and non-technological innovation activity rates by sector and size class, 2010 - 2012 | ||||||||||||
| % | ||||||||||||
| Sector of activity | Size class | |||||||||||
| Industry | Services | Small | Medium | Large | All enterprises | |||||||
| (10-49) | (50-249) | (250+) | ||||||||||
| % of total enterprises with innovation activities | 66.2 | 55.0 | 54.0 | 74.5 | 84.5 | 58.7 | ||||||
| % of total turnover that is generated by enterprises with innovation activities | 90.4 | 81.0 | 68.5 | 74.4 | 94.6 | 84.0 | ||||||
| % of total persons engaged who work in enterprises with innovation activities | 82.6 | 74.6 | 56.9 | 76.7 | 87.8 | 77.7 | ||||||
Introduction
The Community Innovation Survey (CIS) 2012 is a survey of innovation activities of enterprises in Ireland and other EU Member States. The CIS is carried out under the Statistics (Community Innovation Survey) Order 2013 (S.I. no. 66 of 2013) made under the Statistics Act, 1993. The survey collects information about product and process innovation as well as organisational innovations and other key variables during the three year period 2010 to 2012 inclusive. Most questions cover new or significantly improved goods or services or the implementation of new or significantly improved processes, logistics or distribution methods.
The CIS was previously conducted by Forfas but is now jointly conducted by the CSO and Forfas to increase efficiency in the collection of statistical data and to reduce the burden on the participating enterprises. Data were collected in accordance with Section 33 of the Statistics Act, 1993 and with EU law and the survey was carried out under the agreed set of international rules as laid out in the OECD Oslo manual. Data are strictly confidential and will be used only for statistical purposes.
Survey
The CIS survey sampled enterprises with ten or more persons engaged in the selected NACE categories as included in the table below. The CSO and Forfas jointly conducted a postal survey in June 2013. A total of 4,650 survey forms were issued to the sampled enterprises from the CSO’s Business Register.
|
Nace Rev. 2 |
|
|
Sections and Divisions |
Description |
|
B (05-09) |
Mining and quarrying |
|
C (10-33) |
Manufacturing |
|
D (35) |
Electricity, gas, steam and air conditioning supply |
|
E (36-39) |
Water supply; sewerage, waste management and remediation activities |
|
G (46) |
Wholesale trade, except of motor vehicles and motorcycles |
|
H (49-53) |
Transportation and Storage |
|
J (58,59,60,61,62,63) |
Information and communication |
|
K (64-66) |
Financial and insurance activities |
|
M (71-73) |
Architectural and engineering activites; technical testing and analysis; scientific research and development; advertising and market research |
Questionnaire
The CIS questionnaire is available from the CSO website. Go to www.cso.ie and then go to Business Sectors: Science and Technology.
Definitions:
Product Innovation:
The market introduction of a new or a significantly improved good or service with respect to its capabilities, user friendliness, components or sub-systems. The product innovation could either be new to the market or new to the firm.
Process Innovation:
The implementation of a new or significantly improved production process, distribution method, or support activity for goods and services. The process innovation could either be new to the market or new to the firm.
New to Market Innovation:
An innovation activity, which saw the introduction of a new or significantly improved good or service by the firm onto its operating market before other competitors.
New to Firm Innovation:
An innovation activity which saw the introduction of a new or significantly improved good or service to the firm, that was already available from competitors in the operating sector.
Innovation Expenditure:
Spending on activities to support and implement production or process innovations.
Organisational Innovation:
The implementation of new or significant changes in firm structure or management methods that are intended to improve your firms use of knowledge, the quality of your goods and services or the efficiency of work flows.
 Hide Background Notes
Scan the QR code below to view this release online or go to
http://www.cso.ie/en/releasesandpublications/er/iie/innovationinirishenterprises2012/
 Show Table 1: Technological innovation expenditure by nationality of ownership, sector and size class, 2012
 Hide Table 1: Technological innovation expenditure by nationality of ownership, sector and size class, 2012