CensusAtSchool is a non-profit making international project funded by organisations interested in promoting good use of statistics, mathematics and data handling. Ireland became involved in CensusAtSchool in 2009 when the Professional Development Service for Teachers (PDST), the CSO, Project Maths and the National Council for Curriculum and Assessment (NCCA) collaborated to set-up the Irish website www.censusatschool.ie.
4,199 (1.1%) from an estimated 380,000 secondary school students completed the Phase 15 questionnaire of the CensusAtSchool survey between September 2015 and August 2016. The questionnaire covered a variety of topics ranging from 1916 related topics, the level of Irish speaking to the type of school transport used.
Interesting findings from Phase 15 results:
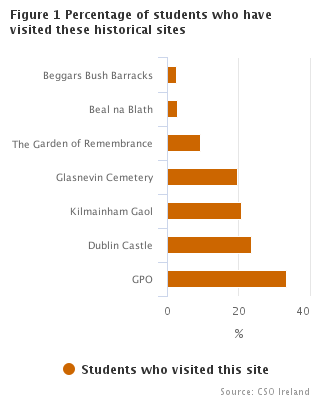
| Historical Site Visited | Much enjoyment | Neutral enjoyment | Little to no enjoyment |
|---|---|---|---|
| GPO | 45.1474201474201 | 29.3450881612091 | 24.9859313449634 |
| Dublin Castle | 31.6339066339066 | 22.2921914357683 | 16.9949352841868 |
| Kilmainham Gaol | 27.948402948403 | 18.3879093198992 | 15.3629712999437 |
| Glasnevin Cemetery | 26.5356265356265 | 16.7506297229219 | 14.8002250984806 |
| The Garden of Remembrance | 13.4520884520885 | 6.04534005037783 | 7.03432751828925 |
| Béal na Bláth | 3.74692874692875 | 2.51889168765743 | 1.91333708497468 |
| Beggars Bush Barracks | 3.80835380835381 | 1.38539042821159 | 2.13843556555993 |
| Mode of transport | Students who used this type of transport |
|---|---|
| Car | 43.6974789915966 |
| Bus | 27.1308523409364 |
| Walk | 20.1920768307323 |
| Cycle | 4.56182472989196 |
| Other | 2.54501800720288 |
| Rail | 1.39255702280912 |
| Boat | 0.480192076830732 |
| All sexes | |
| First Year | 0.602941176470588 |
| Second Year | 0.52327221438646 |
| Third Year | 0.375 |
| Transition Year | 0.489885664028144 |
| Fifth Year | 0.556451612903226 |
| Sixth Year | 0.488888888888889 |
| Answer | Do you speak Irish? |
|---|---|
| Not stated | 6.163 |
| No | 28.595 |
| Yes | 65.241 |
| How often do you speak Irish? | |
|---|---|
| Daily | 07.58241758241758 |
| Weekly | 12.7106227106227 |
| Monthly | 08.13186813186813 |
| Yearly | 08.79120879120879 |
| Never outside school | 62.7838827838828 |
| X-axis label | Male | Female |
|---|---|---|
| Do not attend Gaelscoil | 30.6451612903226 | 20.9302325581395 |
| Attend Gaelscoil | 31.7073170731707 | 23.0769230769231 |
| X-axis label | Male | Female |
|---|---|---|
| Do not attend Gaelscoil | 41.6812609457093 | 47.0661672908864 |
| Attend Gaelscoil | 42.7906976744186 | 46.218487394958 |
| X-axis label | Male | Female |
|---|---|---|
| Over 13 sports | 6.91 | 6.2 |
| 10 to 12 sports | 7.16 | 6.35 |
| 7 to 9 sports | 9.96 | 11.91 |
| 4 to 6 sports | 17.58 | 21.47 |
| 1 to 3 sports | 32.17 | 32.23 |
| No sports | 26.25 | 21.86 |
| X-axis label | Usage by female students |
|---|---|
| Proud | 14.38 |
| Hard-working | 6.05 |
| Fun | 4.61 |
| Friendly | 3.47 |
| Green | 3.42 |
| Craic | 3.27 |
| Lucky | 2.63 |
| Amazing | 2.33 |
| Grand | 2.33 |
| Good | 2.28 |
| X-axis label | Usage by Male students |
|---|---|
| Proud | 13.5 |
| Hard-working | 7.39 |
| Craic | 4.04 |
| Alcohol | 3.54 |
| Good | 3.26 |
| Great | 3.08 |
| Fun | 2.71 |
| Potatoes | 2.48 |
| Green | 1.93 |
| Irish | 1.84 |
The Royal Statistical Centre for Statistical Education (RSSCSE) started the CensusAtSchool project in 2000 in conjunction with the Office of National Statistics (ONS) in the UK. The project, originally a one-off, was linked to the UK population census of 2001. It has now developed into a dynamic, on-going and exciting initiative running in a number of countries. Further information can be found here:
USA http://ww2.amstat.org/censusatschool/index.cfm
Canada http://www.censusatschool.ca/
Australia http://www.abs.gov.au/censusatschool
New Zealand http://new.censusatschool.org.nz/explore/
UK http://www.censusatschool.com/
Japan http://census.ism.ac.jp/cas/
4,199 secondary school attendees from 169 secondary schools completed the Phase 15 questionnaire of the CensusAtSchool survey between September 2015 and August 2016. Because the survey is voluntary and not part of a representative sampling process, the results of the survey are less reliable in providing inferences about the overall secondary school student population.
The CensusAtSchool Phase 15 questionnaire and more results from the survey can be found on the CensusAtSchool website at http://www.censusatschool.ie/en/take-part/questionnaires
A data tool for examining CensusAtSchool data can be found:
http://censusatschool.com/getmydata.php
http://new.censusatschool.org.nz/explore/

Note: The map only includes survey responses when the roll number on the questionnaire response matched a school roll number provided by the Department of Education and Skills.
 Hide Background Notes
Scan the QR code below to view this release online or go to
http://www.cso.ie