
| Year PPSN allocated | Allocations to foreign nationals aged 15 & over | Number with no employment activity 2013-2018 | Employment activity by year | |||||
| 2013 | 2014 | 2015 | 2016 | 2017 | 2018 | |||
| 2013 | 75,720 | 32,988 | 28,885 | 31,545 | 25,491 | 22,665 | 20,726 | 19,541 |
| 2014 | 85,668 | 35,634 | 35,166 | 37,911 | 30,698 | 26,830 | 24,696 | |
| 2015 | 82,744 | 29,375 | 41,848 | 41,607 | 33,077 | 29,344 | ||
| 2016 | 94,955 | 30,458 | 51,910 | 51,396 | 42,090 | |||
| 2017 | 102,824 | 34,097 | 57,461 | 57,399 | ||||
| 2018 | 109,303 | 44,317 | 64,930 | |||||
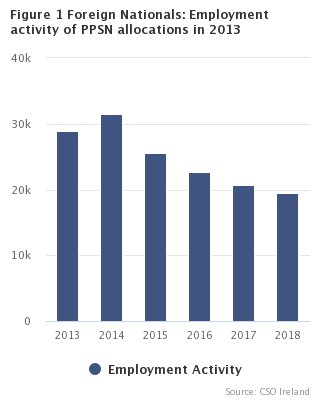
Personal Public Service Numbers (PPSN) were assigned to 75,720 foreign nationals aged 15 years and over in 2013. Of those, 31,545 (41.7%) had employment activity in the year following allocation of PPSN, while 19,541 (25.8%) had employment activity at any time during 2018. See table 2.
This data is based upon an annual analysis of records of the Revenue Commissioners, the Department of Employment Affairs and Social Protection, and the CSO, based on foreign nationals who were allocated PPSNs during the period 2002-2018.
Note: Unless otherwise indicated, the term “activity” in this release means any PAYE employment or any engagement with the social welfare system.
The analysis also shows that: