
A CSO Frontier Series Output - What is this?
The best available data at a national level for land cover statistics is the CORINE Land Cover (CLC) dataset. Ireland’s CORINE Land Cover dataset is produced by the Environmental Protection Agency (EPA) for the European Environment Agency (EEA) using satellite imagery from Copernicus and national level data, which included data from the Department of Agriculture, Food and the Marine, Coillte, and the Forest Service. It is a comprehensive dataset giving full coverage of the country, with broad land cover classes providing a useful overview of the land cover types in Ireland. There are some limitations to its use for developing ecosystem accounts: it is designed to be a land cover product rather than an ecosystem map, the land cover classes are not refined enough to distinguish between some types of ecosystems, and the minimum mapping unit of 25 hectares means that a lot of detail is lost. The two most recent CORINE Land Cover datasets cover 2012 (CLC2012) and 2018 (CLC2018).
A range of classification systems are in use for land cover, land use, ecosystems, and habitats. The classification system used will depend on the user’s requirements and the level of information available. In this publication, we use the overarching ecosystem types proposed by the European project on Mapping and Assessment of Ecosystems and their Services (MAES)8, which set out 12 ecosystem types, including both grasslands and croplands. MAES was part of Target 2 (Action 5) of the EU Biodiversity Strategy to 20209. See Table 2.1 for linkages between MAES ecosystem types and CORINE Land Cover Classes.
The CLC classes relating to grasslands and croplands are presented in Table 2.1; descriptions are taken from the CLC nomenclature document10. It is important to note that the minimum mapping unit in CLC is 25 hectares (about the size of 25 rugby pitches). This means that a lot of detail is lost when classifying land cover to one of the CLC classes, e.g. it does not provide information on semi-natural features such as hedgerows.
Table 2.1 CORINE Land Cover classes for grasslands and croplands ecosystems (descriptions from Updated CLC Illustrated Nomenclature Guidelines10, correspondence based on MAES8). | ||
|---|---|---|
| Ecosystem | CORINE Class | Description |
| Grasslands | Natural grasslands1 | Grasslands under no or moderate human influence. Low productivity grasslands. Often situated in areas of rough, uneven ground, steep slopes; frequently including rocky areas or patches of other (semi-)natural vegetation. |
| Pastures | Permanent grassland characterized by agricultural use or strong human disturbance. Floral composition dominated by grasses and influenced by human activity. Typically used for grazing (pastures), or mechanical harvesting of grass (meadows). | |
| Croplands | Complex cultivation patterns | Mosaic of small cultivated land parcels with different cultivation types - annual crops, pasture and/or permanent crops, with scattered houses or gardens. |
| Fruit trees and berry plantations | Cultivated parcels planted with fruit trees and shrubs, intended for fruit production, including nuts. The planting pattern can be by single or mixed fruit species, both in association with permanently grassy surfaces. | |
| Non-irrigated arable land | Cultivated land parcels under rainfed agricultural use for annually harvested non-permanent crops, normally under a crop rotation system, including fallow lands within such crop rotation. Fields with sporadic sprinkler-irrigation with non-permanent devices to support dominant rainfed cultivation are included. | |
| Land principally occupied by agriculture, with significant areas of natural vegetation | Areas principally occupied by agriculture, interspersed with significant natural or semi-natural areas (including forests, shrubs, wetlands, water bodies, mineral outcrops) in a mosaic pattern. | |
| 1 This CLC class is named ‘Natural grasslands’, but in Ireland practically all grasslands are managed to some degree3. | ||
It is not possible to use the CORINE Land Cover classes to determine the extent of Improved and Semi-natural grasslands. The CLC class ‘Pastures’ may contain both Improved and Semi-natural grasslands, depending on the management regime. Note that grasslands and croplands often co-occur in the landscape, forming mosaics. Grasslands can be found in the two CLC classes ‘Complex cultivation patterns’ and ‘Land principally occupied by agriculture, with significant areas of natural vegetation’.
The majority of the land area in Ireland is managed to some degree for agricultural purposes – in 2018 around 68% could be classified as grasslands and croplands (based on CLC2018, see Figure 2.1). Over half of the land cover in Ireland was grasslands (just under 56%), which is a large proportion when compared to the EU average of 10% (see Copernicus CORINE Land Cover dashboard). Croplands in Ireland covered a relatively low proportion of the country, at 12%, while the EU average was 37%. Forests and woodlands covered around 10% of the land area in Ireland in 2018, while in the EU coverage was almost 40%. The CORINE Land Cover class 'Peat bogs' covered around 14% of the land area in Ireland, a much greater proportion than for the EU, which was around 1%. A recent Frontier Publication Peatlands and Heathlands 2018 explores Ireland’s peatlands in more detail.
| Wetlands (excluding Peat bogs) | Waterbodies | Peat bogs | Other semi-natural areas | Moors and heathlands | Forests and woodlands | Artificial surfaces | Croplands | Grasslands | |
| Ireland | 1.1 | 2.1 | 13.7 | 1.4 | 1.8 | 9.5 | 2.4 | 12.3 | 55.8 |
| EU-27 | 0.5 | 2.8 | 1.5 | 3.8 | 1.7 | 37.6 | 4.8 | 37.1 | 10.1 |
Grasslands and croplands covered just over 4.8 million hectares in 2018, with 82% in grasslands and 18% in croplands (see Table 2.2). ‘Pastures’ was the most common land cover type, at more than 80% of the grasslands and croplands, while ‘Natural grassland’ covered just over 1%. ‘Land principally occupied by agriculture, with significant areas of natural vegetation’ covered more than 10% of the grasslands and croplands area, with ‘Non-irrigated arable land’ covering almost 7%, and ‘Complex cultivations patterns’ at more than 1% (Table 2.2). (Note: 'Fruit trees and berry plantations' covered less than 300 hectares in 2018, and has been excluded from the extent accounts as this is likely to be an underestimate. This land cover type will be included in future publications).
This extent does not include 'Green urban areas' (3,197 hectares in 2018), which includes Amenity grasslands. This land cover type will be explored in the context of Urban ecosystems in a future publication.
| Table 2.2 Extent account for grasslands and croplands using CORINE Land Cover 2012 and 2018 | ||||||||||
| hectares | ||||||||||
| Grasslands | Croplands | Total grasslands and croplands | ||||||||
| Pastures | Natural grassland | Total grasslands | Land principally occupied by agriculture, with significant areas of natural vegetation | Non-irrigated arable land | Complex cultivation patterns | Total croplands | ||||
| Opening extent (CLC2012) | 3,887,461 | 48,526 | 3,935,987 | 486,893 | 332,985 | 59,392 | 879,270 | 4,815,257 | ||
| Net change | 6,412 | 42 | 6,453 | 548 | -12,656 | -1,181 | -13,288 | -6,835 | ||
| Closing extent (CLC2018) | 3,893,873 | 48,567 | 3,942,440 | 487,440 | 320,329 | 58,212 | 865,981 | 4,808,422 | ||
Trends in changes to extent and/or condition can indicate a change in the potential of ecosystems to deliver ecosystem services. In addition to the CORINE Land Cover dataset, a Land Cover Change dataset was produced by the EPA, and the land cover changes between 2012 and 2018 are shown in Table 2.3. The change dataset, however, has a smaller minimum mapping unit (5 hectares) than the standard land cover dataset used to map the spatial extent (25 hectares). This means that the spatial extent shown in Table 2.2 is not directly comparable with the changes in spatial extent shown in Table 2.3, as they are calculated using data at different resolutions.
A total of 129,204 hectares changed from or to grasslands or croplands between 2012 and 2018 (Table 2.3). The main land cover changes were ‘Non-irrigated arable land’ changing to ‘Pastures’ (over 45% of the changes) and ‘Pastures’ changing to ‘Non-irrigated arable land’ (almost 42% of the changes).
The other large changes were from ‘Pastures’ to ‘Transitional woodland-shrub’ (8.1%) and ‘Land principally occupied by agriculture’ to ‘Transitional woodland-shrub (2.2%). This last class – Transitional woodland-shrub – is a CLC class that includes young forest plantations and naturally regenerating scrub, so these changes could be afforestation or encroachment of scrub from land abandonment.
One of the main threats to grassland and cropland ecosystems is the conversion of these areas to artificial surfaces through urbanisation, a phenomenon known as land take. Over the 2012 to 2018 period, 2,333 hectares of grasslands and croplands were lost to land take, mainly through changes to 'Construction sites', 'Road and rail networks and associated land', and 'Industrial or commercial units'. (Note that this does not include land take from one-off housing, as this is too small to detect even with the lower resolution Land Cover Change data).
| Table 2.3 Land cover changes from or to grasslands or croplands between 2012 and 2018 (CLC Land Cover Change) | |||
| Change from | Change to | Area (hectares) | Percentage change1 |
| Non-irrigated arable land | Pastures | 58,248 | 45.1 |
| Pastures | Non-irrigated arable land | 54,111 | 41.9 |
| Pastures | Transitional woodland-shrub | 10,428 | 8.1 |
| Land principally occupied by agriculture | Transitional woodland-shrub | 2,812 | 2.2 |
| Pastures | Construction sites | 1,091 | 0.8 |
| Non-irrigated arable land | Transitional woodland-shrub | 656 | 0.5 |
| Non-irrigated arable land | Construction sites | 369 | 0.3 |
| Pastures | Road and rail networks and associated land | 242 | 0.2 |
| Pastures | Industrial or commercial units | 204 | 0.2 |
| Fruit trees and berry plantations | Non-irrigated arable land | 89 | 0.1 |
| Land principally occupied by agriculture | Non-irrigated arable land | 77 | 0.1 |
| Pastures | Complex cultivation patterns | 72 | 0.1 |
| Land principally occupied by agriculture | Mineral extraction sites | 71 | 0.1 |
| Non-irrigated arable land | Industrial or commercial units | 68 | 0.1 |
| Complex cultivation patterns | Pastures | 66 | 0.1 |
| Pastures | Discontinuous urban fabric | 64 | 0.1 |
| Natural grasslands | Transitional woodland-shrub | 64 | 0.1 |
| Pastures | Mineral extraction sites | 58 | <0.1 |
| Fruit trees and berry plantations | Pastures | 54 | <0.1 |
| Land principally occupied by agriculture | Pastures | 51 | <0.1 |
| Non-irrigated arable land | Sport and leisure facilities | 40 | <0.1 |
| Non-irrigated arable land | Mineral extraction sites | 38 | <0.1 |
| Pastures | Broad-leaved forest | 34 | <0.1 |
| Mineral extraction sites | Pastures | 32 | <0.1 |
| Pastures | Dump sites | 32 | <0.1 |
| Non-irrigated arable land | Discontinuous urban fabric | 30 | <0.1 |
| Peat bogs | Non-irrigated arable land | 20 | <0.1 |
| Pastures | Sport and leisure facilities | 19 | <0.1 |
| Construction sites | Pastures | 16 | <0.1 |
| Mixed forest | Non-irrigated arable land | 12 | <0.1 |
| Pastures | Coniferous forest | 12 | <0.1 |
| Land principally occupied by agriculture | Construction sites | 7 | <0.1 |
| Inland marshes | Non-irrigated arable land | 7 | <0.1 |
| Land principally occupied by agriculture | Transitional woodland-shrub | 5 | <0.1 |
| Sport and leisure facilities | Non-irrigated arable land | 5 | <0.1 |
| Total change | 129,204 | 100 | |
| 1 Due to rounding, percentages may not sum to 100 | |||
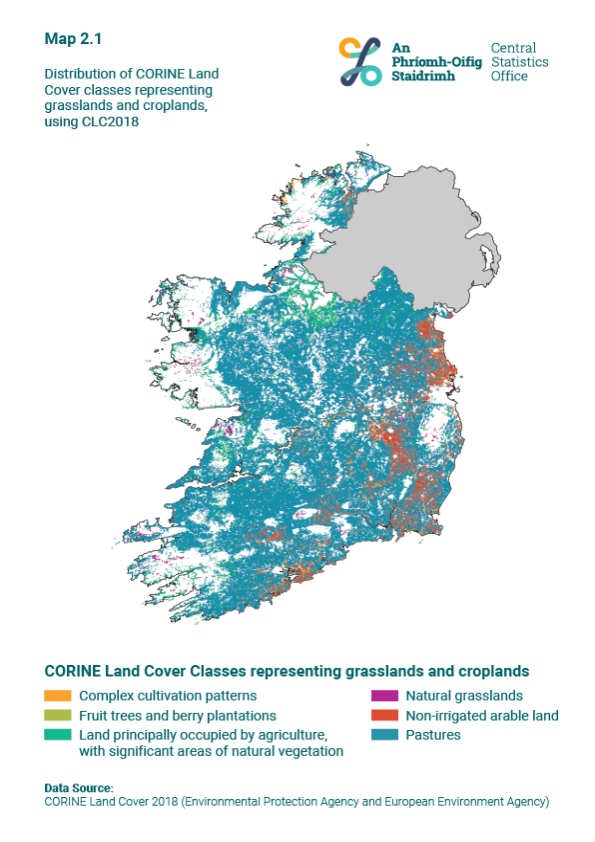
Grasslands and croplands are not distributed equally around Ireland (Map 2.1). ‘Pastures’ occur throughout the country, with notable absences along the west coast and in the Wicklow mountains. ‘Non-irrigated arable land’ and ‘Complex cultivation patterns’ are mostly concentrated along the east and south coast. ‘Land principally occupied by agriculture, with significant areas of natural vegetation’ occurs mainly in the north and along the western coast. ‘Natural grasslands’ occur in upland areas such as the Wicklow mountains and along the west coast.
Grasslands and croplands covered around 68% of Ireland in 2018, and this varied from county to county (Table 2.4, Figure 2.2, Map 2.2, Map 2.3, Map 2.4). Donegal had the lowest proportion of grasslands and croplands, at just under 40%. Dublin, Kerry, and Mayo were the counties with the next lowest proportions, with less than 50% of the county area covered by grasslands and croplands. Donegal, Kerry, and Mayo were the counties with the highest coverage of peatlands and heathlands (see Peatlands and Heathlands 2018), while in Dublin much of the land is covered by artificial surfaces and the built environment (this will be further explored in future publications). Meath and Monaghan, in contrast, each had over 90% of their area covered in grasslands and croplands (Table 2.4, Figure 2.3).
Cork was the county with the largest area of both ‘Pastures’ and ‘Complex cultivation patterns’ in 2018, at over 12% of the national area of ‘Pastures’ and more than 21% of the national area of ‘Complex cultivation patterns’ (Figure 2.3, Table 2.4, Table 2.6). Leitrim was the county with the largest extent of ‘Land principally occupied by agriculture, with significant areas of natural vegetation’, at 14% of the national area. Kerry had 20% of the ‘Natural grasslands’ in the country, while Wexford had about 17% of the ‘Non-irrigated arable land’.
Leitrim had the lowest coverage of grasslands, at less than 20% of the area of the county, while more than 84% of the land cover in Monaghan was grassland. ‘Natural grasslands’ make up a small proportion of the overall grasslands category and were not found in the CLC2018 dataset for nine counties (Table 2.5). Clare, Kerry and Leitrim were the counties with the highest proportion of ‘Natural grasslands’, at around 2% of the county area (Table 2.5, Figure 2.3).
Longford had the lowest coverage of croplands at just over 2% while the highest was in Leitrim at more than 43%, where the croplands were composed entirely of ‘Land principally occupied by agriculture, with significant areas of natural vegetation’. The next highest percentages for this land cover type were in Cavan and Sligo at around 13%. ‘Non-irrigated arable land’ was concentrated in the eastern counties of Carlow, Dublin, Kildare, Louth, and Wexford, where more than a fifth of the land was in this class (Table 2.5, Figure 2.3).
| Table 2.4 Area in hectares of CLC2018 grassland and cropland land cover classes by county | ||||||||
| hectares | % | |||||||
| County | Pastures | Natural grasslands | Non-irrigated arable land | Land principally occupied by agriculture, with significant areas of natural vegetation | Complex cultivation patterns | Total grasslands and croplands | Total grasslands and croplands | |
| Carlow | 55,100 | 0 | 19,537 | 3,621 | 962 | 79,220 | 88.4 | |
| Cavan | 131,233 | 0 | 133 | 25,957 | 0 | 157,323 | 81.5 | |
| Clare | 172,098 | 6,367 | 60 | 40,537 | 26 | 219,088 | 64.6 | |
| Cork | 478,167 | 841 | 42,121 | 49,915 | 12,602 | 583,646 | 77.6 | |
| Donegal | 134,086 | 5,840 | 4,078 | 41,592 | 6,462 | 192,058 | 38.6 | |
| Dublin | 19,272 | 189 | 20,768 | 2,586 | 3,149 | 45,964 | 47.8 | |
| Galway | 291,216 | 4,293 | 1,042 | 46,817 | 1,063 | 344,431 | 55.9 | |
| Kerry | 192,241 | 9,761 | 808 | 33,884 | 430 | 237,124 | 49 | |
| Kildare | 97,768 | 1,487 | 35,231 | 3,181 | 1,880 | 139,547 | 82.4 | |
| Kilkenny | 162,117 | 28 | 13,988 | 3,096 | 4,554 | 183,783 | 88.7 | |
| Laois | 109,301 | 0 | 15,645 | 5,273 | 6,147 | 136,366 | 79.3 | |
| Leitrim | 27,332 | 3,261 | 0 | 68,569 | 0 | 99,162 | 62.4 | |
| Limerick | 212,709 | 951 | 687 | 15,194 | 485 | 230,026 | 83.5 | |
| Longford | 81,159 | 0 | 62 | 2,447 | 60 | 83,728 | 76.7 | |
| Louth | 42,951 | 310 | 23,895 | 1,890 | 2,027 | 71,073 | 80.6 | |
| Mayo | 207,664 | 6,186 | 43 | 49,100 | 46 | 263,039 | 46.3 | |
| Meath | 174,142 | 0 | 38,810 | 3,679 | 2,208 | 218,839 | 93.2 | |
| Monaghan | 109,252 | 0 | 41 | 10,870 | 0 | 120,163 | 92.9 | |
| Offaly | 124,936 | 0 | 6,270 | 5,310 | 4,615 | 141,131 | 70.6 | |
| Roscommon | 167,611 | 690 | 214 | 19,886 | 90 | 188,491 | 74 | |
| Sligo | 90,357 | 2,816 | 33 | 24,175 | 62 | 117,443 | 61.9 | |
| Tipperary | 317,023 | 1,082 | 19,475 | 6,211 | 2,561 | 346,352 | 80.5 | |
| Waterford | 122,337 | 1,082 | 7,445 | 4,647 | 2,259 | 137,770 | 73.5 | |
| Westmeath | 137,367 | 78 | 3,496 | 5,805 | 571 | 147,317 | 80.1 | |
| Wexford | 149,554 | 218 | 55,341 | 2,461 | 4,853 | 212,427 | 88.9 | |
| Wicklow | 86,881 | 3,087 | 11,109 | 10,736 | 1,101 | 112,914 | 55.7 | |
| Ireland1 | 3,893,874 | 48,567 | 320,332 | 487,439 | 58,213 | 4,808,425 | 68.1 | |
| 1 Due to rounding, there may be some small differences between totals in this table and Table 2.2 | ||||||||
| X-axis label | Pastures | Natural grasslands | Non-irrigated arable land | Land principally occupied by agriculture, with significant areas of natural vegetation | Complex cultivation patterns |
|---|---|---|---|---|---|
| Carlow | 55100 | 0 | 19537 | 3621 | 962 |
| Cavan | 131233 | 0 | 133 | 25957 | 0 |
| Clare | 172098 | 6367 | 60 | 40537 | 26 |
| Cork | 478167 | 841 | 42121 | 49915 | 12602 |
| Donegal | 134086 | 5840 | 4078 | 41592 | 6462 |
| Dublin | 19272 | 189 | 20768 | 2586 | 3149 |
| Galway | 291216 | 4293 | 1042 | 46817 | 1063 |
| Kerry | 192241 | 9761 | 808 | 33884 | 430 |
| Kildare | 97768 | 1487 | 35231 | 3181 | 1880 |
| Kilkenny | 162117 | 28 | 13988 | 3096 | 4554 |
| Laois | 109301 | 0 | 15645 | 5273 | 6147 |
| Leitrim | 27332 | 3261 | 0 | 68569 | 0 |
| Limerick | 212709 | 951 | 687 | 15194 | 485 |
| Longford | 81159 | 0 | 62 | 2447 | 60 |
| Louth | 42951 | 310 | 23895 | 1890 | 2027 |
| Mayo | 207664 | 6186 | 43 | 49100 | 46 |
| Meath | 174142 | 0 | 38810 | 3679 | 2208 |
| Monaghan | 109252 | 0 | 41 | 10870 | 0 |
| Offaly | 124936 | 0 | 6270 | 5310 | 4615 |
| Roscommon | 167611 | 690 | 214 | 19886 | 90 |
| Sligo | 90357 | 2816 | 33 | 24175 | 62 |
| Tipperary | 317023 | 1082 | 19475 | 6211 | 2561 |
| Waterford | 122337 | 1082 | 7445 | 4647 | 2259 |
| Westmeath | 137367 | 78 | 3496 | 5805 | 571 |
| Wexford | 149554 | 218 | 55341 | 2461 | 4853 |
| Wicklow | 86881 | 3087 | 11109 | 10736 | 1101 |
| X-axis label | Pastures | Natural grasslands | Non-irrigated arable land | Land principally occupied by agriculture, with significant areas of natural vegetation | Complex cultivation patterns | Other |
|---|---|---|---|---|---|---|
| Carlow | 61.5 | 0 | 21.8 | 4 | 1.1 | 11.6 |
| Cavan | 68 | 0 | 0.1 | 13.4 | 0 | 18.5 |
| Clare | 50.7 | 1.9 | 0 | 12 | 0 | 35.4 |
| Cork | 63.6 | 0.1 | 5.6 | 6.6 | 1.7 | 22.4 |
| Donegal | 26.9 | 1.2 | 0.8 | 8.4 | 1.3 | 61.4 |
| Dublin | 20 | 0.2 | 21.6 | 2.7 | 3.3 | 52.2 |
| Galway | 47.2 | 0.7 | 0.2 | 7.6 | 0.2 | 44.1 |
| Kerry | 39.7 | 2 | 0.2 | 7 | 0.1 | 51 |
| Kildare | 57.7 | 0.9 | 20.8 | 1.9 | 1.1 | 17.6 |
| Kilkenny | 78.3 | 0 | 6.8 | 1.5 | 2.2 | 11.3 |
| Laois | 63.6 | 0 | 9.1 | 3.1 | 3.6 | 20.7 |
| Leitrim | 17.2 | 2.1 | 0 | 43.2 | 0 | 37.6 |
| Limerick | 77.2 | 0.3 | 0.2 | 5.5 | 0.2 | 16.5 |
| Longford | 74.4 | 0 | 0.1 | 2.2 | 0.1 | 23.3 |
| Louth | 48.7 | 0.4 | 27.1 | 2.1 | 2.3 | 19.4 |
| Mayo | 36.6 | 1.1 | 0 | 8.6 | 0 | 53.7 |
| Meath | 74.2 | 0 | 16.5 | 1.6 | 0.9 | 6.8 |
| Monaghan | 84.4 | 0 | 0 | 8.4 | 0 | 7.09999999999999 |
| Offaly | 62.5 | 0 | 3.1 | 2.7 | 2.3 | 29.4 |
| Roscommon | 65.8 | 0.3 | 0.1 | 7.8 | 0 | 26 |
| Sligo | 47.6 | 1.5 | 0 | 12.7 | 0 | 38.1 |
| Tipperary | 73.7 | 0.3 | 4.5 | 1.4 | 0.6 | 19.5 |
| Waterford | 65.3 | 0.6 | 4 | 2.5 | 1.2 | 26.5 |
| Westmeath | 74.7 | 0 | 1.9 | 3.2 | 0.3 | 19.9 |
| Wexford | 62.6 | 0.1 | 23.2 | 1 | 2 | 11.1 |
| Wicklow | 42.9 | 1.5 | 5.5 | 5.3 | 0.5 | 44.3 |
While CORINE provides useful information on the extent of the overarching ecosystem types, some other data sources can also be used to examine grasslands and croplands in more detail. In this section, we will examine extent using the Land Parcel Identification System (LPIS) data from the Department of Agriculture, Food, and the Marine (DAFM), and Article 17 grassland survey data from the National Parks and Wildlife Service (NPWS).
The Land Parcel Identification System is a geospatial database which was established under Council Regulation (EC) No 73/2009. Its purpose is to assist farmers and authorities within EU member states with the management of applications and payments under the EU Common Agricultural Policy (CAP). In Ireland, DAFM manages the LPIS database. These data are a rich source of land cover and land use information for Ireland. However, this dataset only contains details of land for which payments are made, and does not include public roads, private dwellings not on farmland, or areas in agricultural usage where payments are not received.
The total area of grasslands in 2018 based on LPIS data was almost 4.5 million hectares, while the total area of croplands was 461,236 hectares (Table 2.7).
| Table 2.7 Area of different categories of grasslands and croplands based on Land Parcel Identification System (LPIS) data for 2018 | ||
| Category | Crop description | Area (hectares) |
| Grasslands | Permanent pasture | 4,053,731 |
| Low-input permanent pasture | 281,797 | |
| Traditional hay meadow | 71,372 | |
| Species-rich grassland | 39,671 | |
| Rough grazing | 24,526 | |
| Mixed grazing | 9,439 | |
| Traditional sustainable grazing | 3,830 | |
| Grass silage | 2,782 | |
| Total grasslands | 4,487,148 | |
| Croplands | Barley | 185,909 |
| Temporary grassland | 98,536 | |
| Wheat | 57,738 | |
| Other crops | 25,115 | |
| Maize | 18,250 | |
| Oats | 18,099 | |
| Beet | 11,896 | |
| Oilseed | 10,787 | |
| Peas and beans | 8,614 | |
| Potatoes | 8,404 | |
| Fallow | 5,539 | |
| Vegetables | 3,680 | |
| Arable silage | 3,517 | |
| Fodder rape and kale | 1,855 | |
| Turnips | 1,083 | |
| Apples | 705 | |
| Other cereals | 677 | |
| Nursery etc. | 548 | |
| Fruit | 284 | |
| Total croplands | 461,236 | |
| Habitat/other | Habitat | 33,379 |
| Bog | 52,947 | |
| Other | 72,227 | |
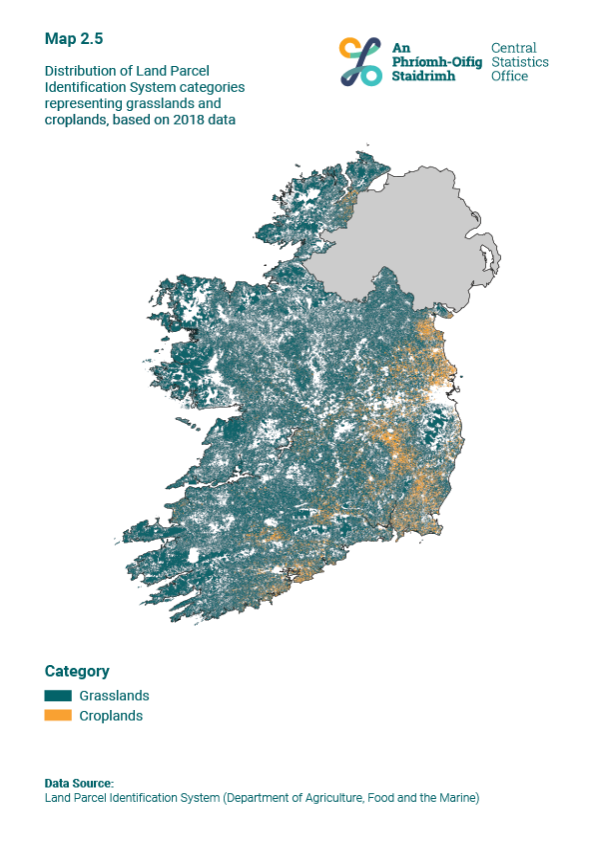
Mapping the LPIS data shows that grasslands occur through the country while croplands are concentrated in the east and south (Map 2.5). This broadly follows the same pattern of land cover seen using the CORINE data (Map 2.1). There is, however, some overlap with areas classified by CORINE as 'Peat bogs' and 'Moors and heathlands'. This is primarily areas of peatland and heathland that are used for grazing, amounting to almost 800,000 hectares (see Peatlands and Heathlands 2018).
Under Article 17 of the EU Directive on the Conservation of Habitats, Flora and Fauna (92/43/EEC) (the Habitats Directive), the National Parks and Wildlife Service (NPWS) report the conservation status of specific habitats to the European Commission. These habitats are known as Annex I habitats as they are listed under Annex I of the Directive. A lot of data on habitats is reported under Article 17, including their geographical range, spatial area, structure and functions, and conservation status.
Annex I grassland habitats in Ireland are described in Table 2.8 below. Article 17 data provide a more detailed breakdown of the spatial extent than the CORINE Land Cover data. These Annex I habitats are a subset of Semi-natural grasslands. Croplands are not covered by the Annex.
Table 2.8 Annex I grassland habitats found in Ireland | ||||
|---|---|---|---|---|
| Annex I grassland habitat | Description | Distribution | ||
| Calcareous grassland | 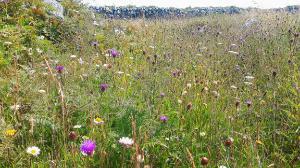 Photo credit: Maria Long Location: Inis Oírr |
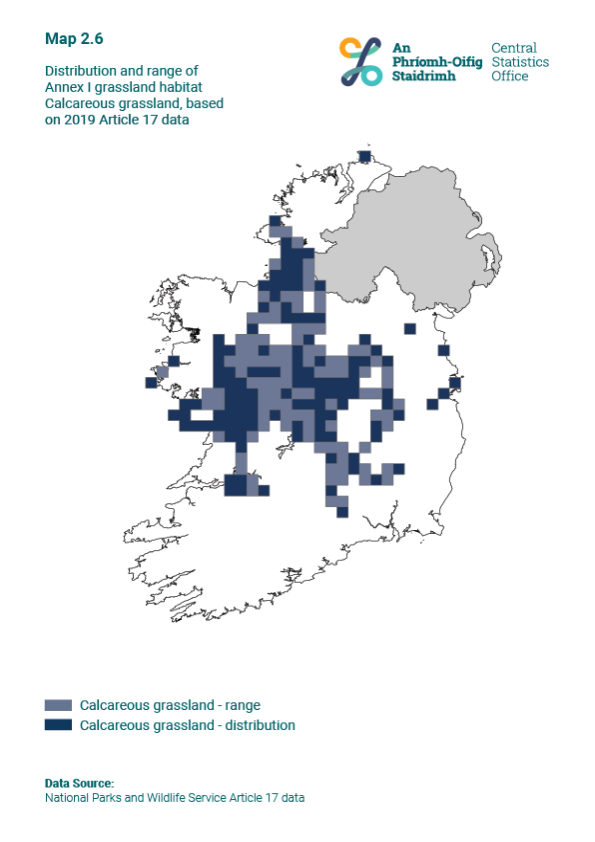
Calcareous grasslands are species-rich grasslands that occur on shallow, well-drained calcareous substrates. Where the site is also important for orchids, it is considered a priority habitat11. | See Map 2.6 | |
| Lowland hay meadow | 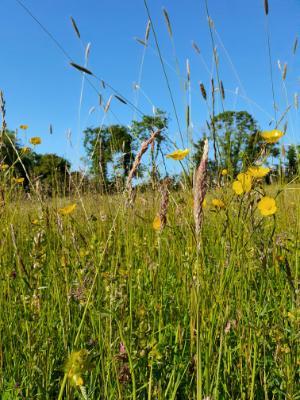 Photo credit: Maria Long Location: Wexford |
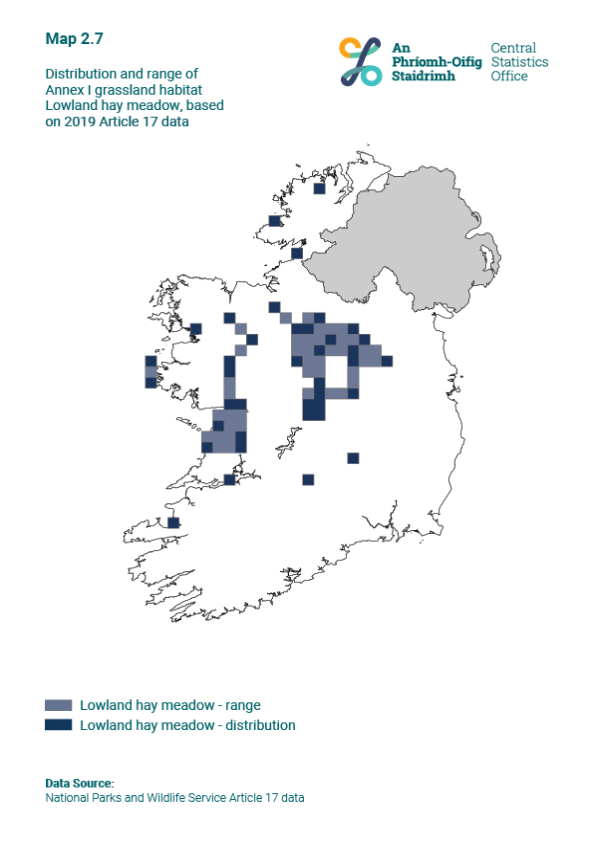
Lowland hay meadows in Ireland are semi-natural grasslands that are generally extensively managed as traditional hay meadows by mowing, typically with one cut late in the season11. Aftergrazing may also occur in late summer. | See Map 2.7 | |
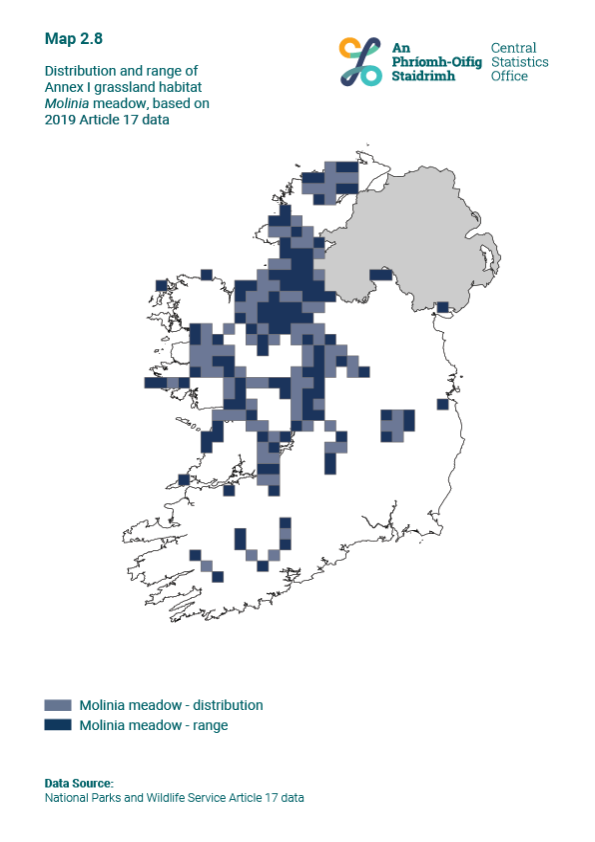
| Molinia meadow | 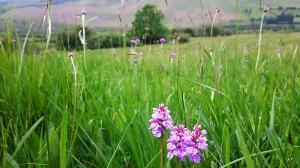 Photo credit: Maria Long Location: Dublin |
Molinia meadows in Ireland are fen and grassland plant communities that occur on nutrient-poor soils. Management usually entails either mowing once a year for hay or use as an extensive pasture11. | See Map 2.8 | |
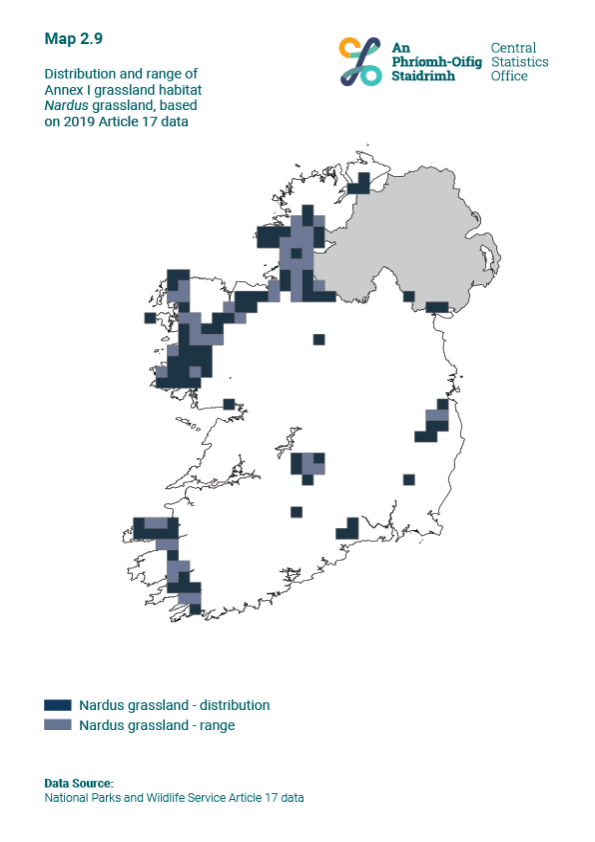
| Nardus grassland | 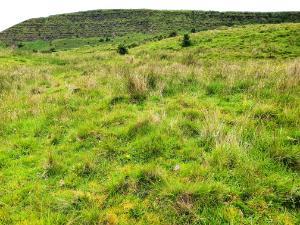 Photo credit: Maria Long Location: Sligo |
Species-rich Nardus grasslands occur in upland areas on siliceous substrates (these are soils containing silica, and tend to be acidic). Extensive grazing is required to maintain this type of grassland, which often occurs in mosaics with heath11. | See Map 2.9 | |
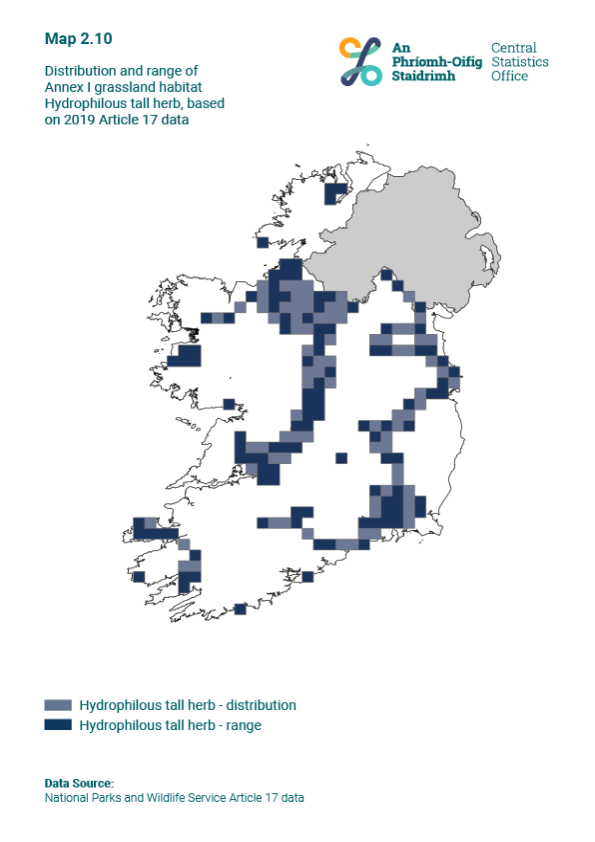
| Hydrophilous tall herb |  Photo credit: NPWS and Jim Martin Location: Roscommon |
Hydrophilous tall-herb swamp can be represented by three different communities in Ireland, only two of which are included in the NPWS assessment (the third requires further study). Of the two communities, one occurs in the lowlands on the edges of waterbodies, and one occurs in the uplands on cliff edges11. | See Map 2.10 | |
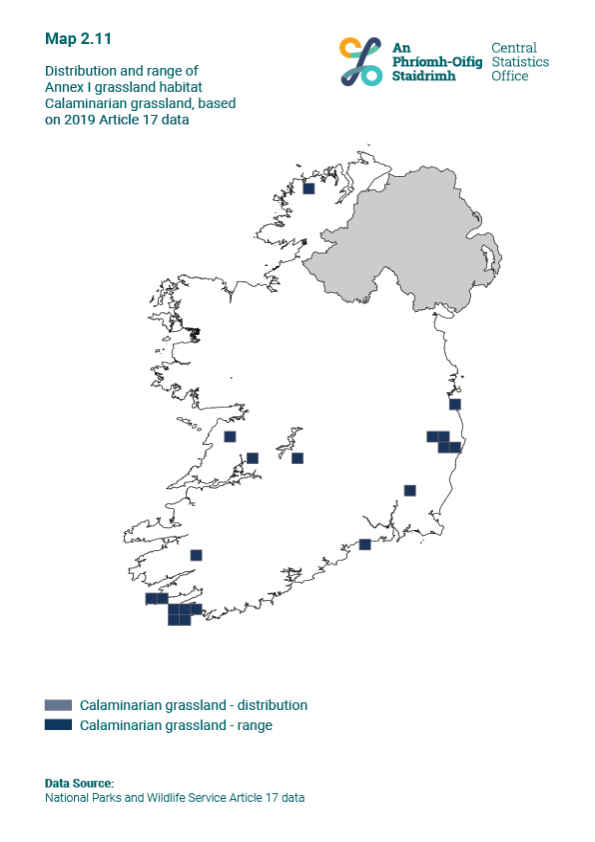
| Calaminarian grassland |  Photo credit: Neil Lockhart Location: Wicklow |
Calaminarian grasslands are characterised by the presence of plants that can tolerate high levels of heavy metals. In Ireland, these are only found on spoil heaps near old mine workings11. | See Map 2.11 | |
These Annex I grassland habitats occur over a small area; Table 2.9 shows the extent as reported by NPWS in the 2019 Habitat Assessment12, while Maps 2.6 to 2.11 show range and distribution. Note that there may be further areas as yet unmapped, but that these are nonetheless very restricted grassland types. However, they are highly diverse and very valuable for nature and they provide a range of ecosystem functions.
| Table 2.9. Extent of Annex I grassland habitats found in Ireland | |
| hectares | |
| Grassland type | Extent (minimum area) |
| Calcareous grassland | 1,416 |
| Lowland hay meadow | 160 |
| Molinia meadow | 586 |
| Nardus grassland | 611 |
| Hydrophilous tall herb | 100 |
| Calaminarian grassland | 6 |
| Data from NPWS Article 17 Habitat Assessments Volume 2 2019 | |
Hedgerows are an integral part of the traditional Irish landscape. Depending on definitions and methodologies, the estimated area of hedgerows can vary. According to a recent study13 there are an estimated 689,000km of hedgerows in the Irish landscape, covering an area of around 2.6%. The National Forest Inventory carried out in 2017 puts the area of hedgerows at 4% of the total land cover14. In addition to hedgerows, the landscape also contains shrubs, trees and small woodlands. Teagasc have estimated the national cover of non-forest woody biomass (i.e. hedgerows plus individual trees, scrub, and small areas of woodland) at 6.4% (450,000ha)15. While hedgerows and other semi-natural features are not included in this assessment, future mapping work will provide valuable data on the extent and location of these important features that contribute to ecosystem structure and function.
3. Fossitt, J. A. A Guide to Habitats in Ireland. (Heritage Council, 2000).
8. Maes, J., Teller, A., Erhard, M., Condé, S. & Vallecilo, S. Mapping and Assessment of Ecosystems and their Services: An EU ecosystem assessment. (2020).
9. EU Biodiversity Strategy to 2020. (European Commission, 2011).
10. Updated CLC Illustrated Nomenclature Guidelines. (European Environment Agency, 2019).
11. The Status of EU Protected Habitats and Species in Ireland. Volume 1: Summary Overview. (National Parks and Wildlife Service, 2019).
12. The Status of EU Protected Habitats and Species in Ireland. Volume 2: Habitat Assessments. (National Parks and Wildlife Service, 2019).
13. National Forest Inventory 2017 Results. (Forest Service, 2017).
14. Countryside Bird Survey. (Birdwatch Ireland, 2019).
15. Integrated farm statistics manual — 2020 edition. (Eurostat, 2020).
Go to the next chapter: Condition
Learn about our data and confidentiality safeguards, and the steps we take to produce statistics that can be trusted by all.