
Your feedback can help us improve and enhance our services to the public. Tell us what matters to you in our online Customer Satisfaction Survey.
A CSO Frontier Series Output - What is this?
Grasslands and croplands in good condition provide benefits to society in the form of ecosystem services. Healthy, resilient, productive ecosystems allow farmers to grow crops, which benefit the consumers of the food produced. Other services reach the wider society in the form of regulating and cultural services, and even provide services on a global basis in the form of climate regulation.
Ecosystem condition is usually assessed against a reference or ‘natural state’, e.g. for forest ecosystems the reference condition would be ancient woodland. Irish grasslands, and croplands by definition, are dependent on human management and intervention – there is no natural state that can be used as a reference. One definition of good condition for grasslands and croplands is “they are in good condition when they support biodiversity, abiotic resources (soil-water-air) are not depleted, and they provide a balanced supply of ecosystem services (provisioning, regulation, cultural)”4.
In this chapter, we will present data on condition in two ways. First, we will present a condition account, using data available at a national level, to give an overall indication of the current condition of grassland and cropland ecosystems, and how this has changed over time. Secondly, we will present data at a catchment level, which will give an indication of how condition varies from place to place.
The EU MAES project proposed a set of indicators for ecosystem condition per ecosystem type4. The recommended indicators meet a range of requirements, including scientific soundness, policy relevance, and providing information on habitat and species conservation. This section presents data for some of the MAES indicators. Where possible, we describe the short-term trend (2010 to 2018) using the following thresholds:
Factors that negatively affect ecosystems are referred to as ecosystem pressures, for example excessive use of fertilisers in agricultural areas can result in pollution of nearby rivers, resulting in a negative impact on the river ecosystem. Pressures can be used as indicators to approximate condition if other indicators for ecosystem condition are not available4. The main pressures for grasslands and croplands are land abandonment, land-use change, changes in intensity of farming systems, introduction of invasive species, pollution and nutrient enrichment, soil erosion, and loss of organic matter in soils4.
Note on climate change
Climate change is a real threat to many ecosystems. While fires and flooding caused by climate change have immediate and obvious effects on ecosystems, some effects can be more subtle, such as the changes to the timing of spring bud burst and flowering in plants (see Plant Phenology for more on this). Aspects of condition influenced by climate change will be examined in future publications where a longer time series is used.
Ecosystem extent – CORINE Land Cover
The extent of grasslands and croplands showed a relatively small decrease between 2012 and 2018, based on CORINE Land Cover data (Table 3.1).
Land take
This indicator measures the pressure from increasing urbanisation on grasslands and croplands, i.e. the conversion of grasslands and croplands to artificial surfaces. Land take through urbanisation is generally irreversible and creates a negative impact through habitat loss and soil sealing. Based on CORINE Land Cover data, land take of grasslands and croplands for 2006-2012 was 2,356 hectares, and similar for 2012-2018 at 2,333 hectares (Table 3.1). As previously noted, this is an underestimation of the amount of land take that has occurred, as the CORINE Land Cover Change data does not include changes of less than 5 hectares, such as construction of one-off housing in rural areas.
Agricultural Area Utilised (AAU)
Based on LPIS data, this is the combined area used for crops, silage, hay, pasture and rough grazing land in use (including fallow land). Areas under roads, tracks, water, bog, marsh, rocks, unused rough grazing land, buildings etc. are excluded. No significant trend was observed between 2010 and 2018 (Table 3.1).
| Table 3.1 Indicators for selected pressures on grassland and cropland ecosystems | ||||||||||||||
| Pressure class | Indicator | Unit | 2010 | 2011 | 2012 | 2013 | 2014 | 2015 | 2016 | 2017 | 2018 | % Change1 | Trend2 | |
| Habitat conversion and degradation (land conversion) | Ecosystem extent | Thousand hectares | - | - | 4,812.0 | - | - | - | - | - | 4,805.2 | -0.1 | No change | |
| Land take3 | Hectares | - | - | 2,356.2 | - | - | - | - | - | 2,333.0 | -1.0 | No change | ||
| Agricultural Area Utilised | Thousand hectares | 4,568.9 | 4,555.5 | 4,532.7 | 4,477.8 | 4,465.8 | 4,431.4 | 4,461.2 | 4,489.5 | 4,516.3 | -1.2 | No change | ||
| 1 Percentage change between first record and last record | ||||||||||||||
| 2 'No change' where % change <5%, 'Degradation' where % change>5%, 'Improvement' where % change <5% | ||||||||||||||
| 3 Land take refers to conversion from grasslands and croplands to artificial surfaces, for example through urbanisation. CLC Change dataset used. Figure for 2012 is for land take 2006-2012, figures for 2018 is for land take 2012-2018 | ||||||||||||||
Measures of environmental quality can be used as proxy indicators of ecosystem condition. The following indicators were selected based on data availability; further indicators may be included in future publications.
Nitrate concentration in groundwater
Groundwater moves underground through cracks and spaces in the subsoil or bedrock and flows into surface waterbodies, and can move nitrate from pollution sources to rivers, lakes, and estuaries16. Under the EU Water Framework Directive, the EPA monitors nitrate concentrations at 194 groundwater monitoring sites. Nitrate concentrations greater than 10mg/l usually indicate a negative impact on the quality of the groundwater arising from human activities. The threshold of 50mg/l relates to the potential for harm to human health16.
The percentage of stations where nitrate concentration exceeded 50mg/l has been consistently low, but has varied from 0% to 1% over the 2010 to 2018 period (Table 3.2).
Organic farming
Organic farming involves production methods which limit or avoid the use of synthetic chemicals including fertilisers, pesticides, additives, and veterinary medicine products. Within the EU, organic farming needs to comply with Regulation 834/2007 on organic production and labelling of organic products. Regulation 889/2008 provides the detailed rules for implementation. The area under organic farming includes certified areas and areas under conversion. The share of organic farming in total farmed land is used as a proxy for biodiversity-friendly agricultural management practices8.
The share of organic farming as a proportion of the AAU has increased over the period 2000 to 2018, from around 0.5% before 2000 (see Environmental Indicators - Land Use) to 1.65% in 2018 (Table 3.2). While the Irish proportion is low in a European context (the figure for the EU in 2019 was 8.5%), the share of organic farming increased by 50% from 2010 to 2018.
Livestock density
The livestock density index provides the number of livestock units (LSU) per hectare of utilised agricultural area. Livestock density data are transmitted to Eurostat based on the Farm Structure Survey (FSS). An assumption is made that condition is better where the livestock density is lower8. Livestock density increased by 9.5% from 2010 to 2018 (Table 3.2).
The Irish Common Farmland Bird Index
The Irish Common Farmland Bird Index is based on survey data over the period 1998 to 2018. The Index has a value of 100 for the year 2000. While the 2018 index value was over 8% higher than the 2010 value, a lot of variation can be seen in this time series, with five of the nine annual index values lower than the index year. When interpreting these data, it should be noted that significant declines in bird populations occurred in the 1970s and 1980s before the survey began17, and so the index year is a low starting point. For more information on the species included and how the index is calculated see Background Notes and Birdwatch Ireland.
| Table 3.2 Selected condition indicators for grassland and cropland ecosystems | ||||||||||||||
| Condition class | Indicator | Unit | 2010 | 2011 | 2012 | 2013 | 2014 | 2015 | 2016 | 2017 | 2018 | % Change1 | Trend2 | |
| Environmental quality (physical and chemical quality) | Nitrogen concentration in groundwater | % stations > 50mg/l | 0.0 | 0.5 | 0.0 | 0.5 | 1.0 | 1.0 | 1.0 | 0.5 | 1.0 | N/A | N/A | |
| Structural ecosystem attributes (general) | Share of organic farming in AAU | % | 1.10 | 1.10 | 1.16 | 1.20 | 1.16 | 1.65 | 1.72 | 1.66 | 1.65 | 50.0 | Improvement | |
| Livestock density | Livestock Units/hectare | 1.16 | - | - | 1.20 | - | - | 1.27 | - | - | 9.5 | Degradation | ||
| Structural ecosystem attributes based on species diversity and abundance | Farmland Bird Index3 | Index | 102.4 | 99.0 | 95.1 | 93.6 | 99 | 104 | 95.6 | 102.6 | 111.3 | 8.7 | Inconclusive | |
| Structural ecosystem attributes monitored under the EU nature directives and national legislation | Share of grassland habitats listed under Annex I of the Habitats Directive (HD) in favourable conservation status4 | % | - | - | - | 0 | - | - | - | - | 0 | 0 | No change | |
| Share of grassland habitats listed under Annex I of the HD showing unfavourable conservation trends4 | % | - | - | - | 33.3 | - | - | - | - | 83.3 | 150 | Degradation | ||
| Percentage of grasslands and croplands covered by Natura 2000 (SACs and SPAs) | % | - | - | - | 3.7 | - | - | - | - | 3.7 | 0 | No change | ||
| Percentage of grasslands and croplands covered by nationally designated areas (NHAs and pNHAs) | % | - | - | - | 2.3 | - | - | - | - | 2.4 | 0 | No change | ||
| Percentage of grasslands and croplands in all protected areas5 | % | - | - | - | 4.3 | - | - | - | - | 4.3 | 0 | No change | ||
| 1 Percentage change between first record and last record | ||||||||||||||
| 2 'No change' where % change <5%, 'Degradation' where % change>5%, 'Improvement' where % change <5% | ||||||||||||||
| 3 Index year 2000 = 100 | ||||||||||||||
| 4 Data from Article 17 reports for 2013 and 2019 | ||||||||||||||
| 5 Protected areas can overlap | ||||||||||||||
Protected areas
To protect and conserve biodiversity, the European Union has developed two Directives aimed at designating nature conservation areas:
The Habitats Directive identifies threatened habitats and species for which special conservation measures are required through the designation of Special Areas of Conservation (SACs). Annex I of the Directive lists the habitats of interest, including several types of semi-natural grasslands. It also establishes the Natura 2000 network comprising SACs and Special Protection Areas (SPAs) designated under the Birds Directive to protect the habitats of endangered and migratory bird species.
At national level, the Wildlife (Amendment) Act 2000 enables the statutory protection of Natural Heritage Areas (NHAs). These are areas of national importance for habitats and/or species that occur there. On a non-statutory basis, proposed NHA (pNHAs) are also part of this national network but have limited protections compared to NHAs.
Designations for Natura 2000 (SACs, SPAs) and national designations (NHAs and pNHAs) provide information about the protected status of the ecosystems. Most of Ireland’s grasslands and croplands occur outside of protected areas; only around 4% occur inside protected areas. Almost 65% of ‘Natural grasslands’ occur within protected areas, while more than 11% of ‘Land principally occupied by agriculture’ occurs in protected areas (Table 3.3). There has been no change in the area of grasslands and croplands in protected areas between 2012 and 2018 (Table 3.2).
| Table 3.3 Total area of grasslands and croplands in protected areas1 in 2018 | ||||||||||
| hectares | % | |||||||||
| CORINE Land Cover classes | SPAs | SACs | pNHAs | NHAs | Natura 2000 (SACs and SPAs) | National (pNHAs and NHAs) | All protected areas | Outside protected areas | Area occurring inside protected areas | |
| Pastures | 46,328 | 60,324 | 47,053 | 5,668 | 96,014 | 52,680 | 113,881 | 3,778,288 | 2.9 | |
| Natural grasslands | 6,108 | 25,025 | 27,724 | 404 | 25,854 | 28,117 | 31,235 | 17,104 | 64.6 | |
| Total grasslands | 52,436 | 85,349 | 74,777 | 6,072 | 121,868 | 80,797 | 145,116 | 3,795,392 | 3.7 | |
| Complex cultivation patterns | 462 | 507 | 978 | 0 | 860 | 978 | 1,381 | 56,724 | 2.4 | |
| Land principally occupied by agriculture, with significant areas of natural vegetation | 23,451 | 30,729 | 26,060 | 1,719 | 49,367 | 27,753 | 55,115 | 431,271 | 11.3 | |
| Non-irrigated arable land | 2,216 | 1,737 | 3,466 | 27 | 3,769 | 3,493 | 4,962 | 315,153 | 1.6 | |
| Total croplands | 26,129 | 32,973 | 30,504 | 1,746 | 53,996 | 32,224 | 61,458 | 803,148 | 7.1 | |
| Totals and proportion | 78,565 | 118,322 | 105,281 | 7,818 | 175,864 | 113,021 | 206,574 | 4,598,540 | 4.3 | |
| 1 Protected areas are not exclusive from each other | ||||||||||
Article 17 habitat conservation status
Under Article 17 of the Habitats Directive, the National Parks and Wildlife Service (NPWS) reports the conservation status, at national level, of habitats listed in Annex I of the Directive. This conservation status is based on four parameters: the range (i.e. the total geographical area within which the habitat appears, and which is sufficiently large to allow the long-term survival of the habitat), the area, the structure and functions (i.e. includes an evaluation of the condition and the typical species), and future prospects. For more information, refer to the full National Parks and Wildlife Services reports here.
Annex I grasslands in Ireland have an overall assessment of conservation status ranging from inadequate to bad (Table 3.4), and there is a trend over time of deteriorating conservation status11.
Table 3.4. Annex I grasslands - Data from NPWS Article 17 Habitat Assessments Volume 2 2019 | |||
|---|---|---|---|
| Grassland type | Extent (minimum area; hectares) | Overall assessment of conservation status | Overall trend of conservation status |
| Calcareous grassland | 1,416 | Bad | Deteriorating |
| Lowland hay meadow | 160 | Bad | Deteriorating |
| Molinia meadow | 586 | Bad | Deteriorating |
| Nardus grassland | 611 | Bad | Stable |
| Hydrophilous tall herb | 100 | Bad | Deteriorating |
| Calaminarian grassland | 6 | Inadequate | Deteriorating |
There are 46 river catchments and 583 sub-catchments in Ireland18. A catchment can be defined as “the area of land bounded by watersheds draining into a river, basin or reservoir”, and forms a distinct landscape unit. Figure 9 shows the location of each of the catchments (see Table 3.5 for names and area of each catchment). Catchments form a useful spatial unit for ecosystem accounting, and recent Irish work on ecosystem accounting has been carried out at catchment level2,19. Condition accounts at national level are useful to give a snapshot at a point in time or trends over time. However, more granular data at catchment level provide a better insight into local variations. While some of the condition indicators from the previous section are also presented here at catchment level, not all of those indicators are appropriate, or available, at catchment level. We also include some other relevant indicators including water quality and artificial drainage.
Catchments do not follow geopolitical boundaries. Some of these catchments are cross-border catchments, and also drain land in Northern Ireland. Where percentages are given, these are based on the part of the catchment occurring in Ireland.

CORINE Land Cover - extent of grasslands and croplands
Map 3.2 shows the percentage of each catchment covered by grasslands and croplands. These ecosystems are concentrated in the south east, while catchments along the west coast and in the Dublin/Wicklow mountains have a lower proportion of grasslands and croplands. Table 3.5 provides more detail; Galway Bay North is the catchment with the smallest percentage of grasslands, at just over 4%, while Shannon Estuary South has over 87%. For croplands, two of the catchments in the Upper Shannon (26E and 26G) have less than 2%, compared with the Nanny-Delvin at almost 48%. When grasslands and croplands are combined, Galway Bay North has the lowest percentage (just over 15%), while four catchments have more than 90% (Nanny-Delvin, Owenavorragh, Shannon Estuary South, and Ballyteigue-Bannow).

Soil type
Peat bogs covered around 14% of Ireland in 2018 (based on CLC; Figure 1). Extensive drainage and peat harvesting have been historically carried out in Ireland, however, and extensive areas of peaty soils occur outside of active peat forming areas, indicating that these areas were once peatlands. The area of peat soils in agricultural areas is slightly more than 13% (see Table 3.6). Three catchments have no or less than 1% of grasslands and croplands on peaty soils (Owenavorragh, Nanny-Delvin, and Ballyteigue-Bannow), while the Donagh-Moville catchment has the highest proportion, at almost 25% (Table 3.5). The catchments with the largest percentage of grasslands and croplands occurring on peaty soils are in the midlands and west (Map 3.3).
| Table 3.6 Soil texture associated with grasslands and croplands | ||
| hectares | % | |
| Soil texture1 | Area of grasslands and croplands occurring on each soil type | Proportion of grasslands and croplands |
| Unclassified | 81,145 | 1.7 |
| All | 263,579 | 5.5 |
| Clayey | 115,248 | 2.4 |
| Coarse loamy | 912,886 | 19.0 |
| Fine loamy | 2,599,876 | 54.1 |
| Loamy | 167,762 | 3.5 |
| Peat | 632,857 | 13.2 |
| Sandy | 30,575 | 0.6 |
| 1 Soil texture taken from the Irish Soil Information System | ||

Drainage
Under the Arterial Drainage Act, 1945, and the Arterial Drainage (Amendment) Act, 1995, the Office of Public Works (OPW) carried out drainage and flood defence schemes to improve land for agriculture and mitigate flooding. The OPW has an ongoing statutory obligation to maintain these drainage schemes. For the same purpose, Drainage Districts schemes were carried out by the Commissioners of Public Works under different drainage and navigation acts from 1842 to the 1930s. The maintenance of Drainage Districts schemes is the responsibility of Local Authorities. For more information on both drainage schemes, refer to this link.
The OPW refers to lands drained or improved by the execution of drainage works through the Arterial Drainage and Drainage Districts schemes as ‘benefitting’ lands. Table 3.5 and Map 3.4 show the percentage of grasslands and croplands in each catchment categorised as benefitting land by OPW. Six catchments have no grasslands or croplands classed as 'benefitting lands', while the Barrow and Lower Shannon 25A catchments have over 15%. The catchments in the midlands have a higher percentage of benefitting grasslands and croplands than the catchments nearer the coast. Artificial drainage can affect the function of some ecosystems, and can be considered a pressure, for example drainage of semi-natural wet grasslands would negatively affect the specialist species that occur there.

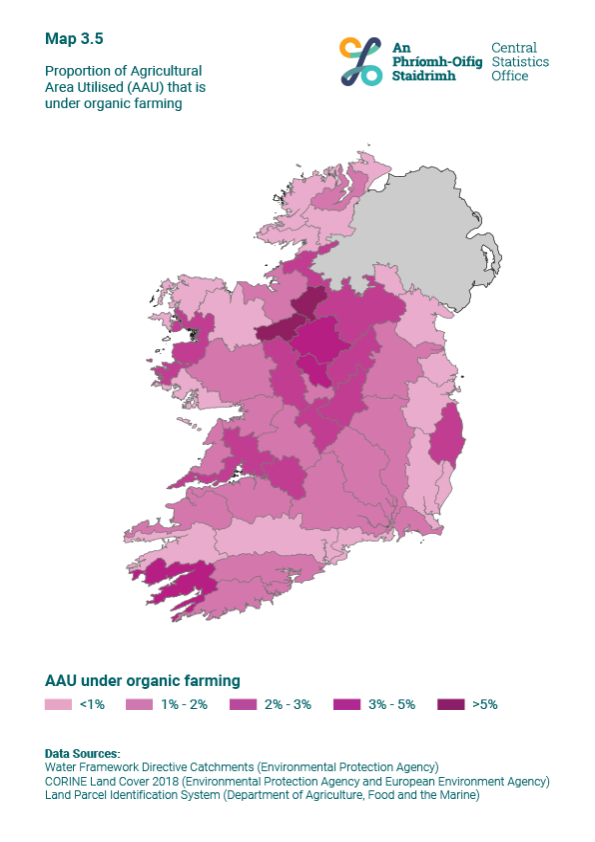
Organic farming
Organic farming covered around 1.65% of the Agricultural Area Utilised (AAU) in 2018 (Table 3.1). The share of organic farming in total farmed land can be used as a proxy for biodiversity-friendly agricultural management practices. The area under organic farming is not spread equally around the country, with one third of catchments having less than 1% of their AAU as organic (Table 3.5). The catchments in the midlands have the highest proportion of organic farming (Map 3.5).
Protected areas
Only 4% of Ireland's grasslands and croplands occur inside protected areas. Almost 65% of ‘Natural grasslands’ occur within protected areas compared with about 11% of ‘Land principally occupied by agriculture’ (Table 3.3). Four catchments have less than 1% of grasslands and croplands occurring within protected areas (Nanny-Delvin, Foyle, Liffey and Dublin Bay, and Owenavorragh), while two catchments have 7% or more (Shannon Estuary North and Tralee Bay-Feale; Table 3.5, Map 3.6).

Water quality
The Water Framework Directive (WFD) requires all Member States to protect and improve water quality in all waters so that good ecological status is achieved by 2027. Water bodies in each catchment are assigned High, Good, Moderate, Poor, or Bad status (some waterbodies were unassigned for the Cycle 3 reporting (2013 to 2018)). The percentage of water bodies achieving Good or High status in 2018 ranged from around 16% for the Galway Bay North catchment to over 70% for the Blackwater (Munster) catchment (Table 3.5, Map 3.7). Note, however, that waterbodies that are at Good status may not be in satisfactory condition if their WFD objective is High status.

2. Norton, D., Hynes, S., Buckley, C., Ryan, M. & Doherty, E. An initial catchment level assessment of the value of Ireland’s agroecosystem services. Biology and Environment: Proceedings of the Royal Irish Academy 120B (2020).
4. Maes, J. et al. Mapping and Assessment of Ecosystems and their Services: An analytical framework for mapping and assessment of ecosystem condition in EU. (2018).
16. Green, S., Martin, S., Gharechelou, S., Cawkwell, F. & Black, K. BRIAR: Biomass Retrieval in Ireland Using Active Remote Sensing. (Environmental Protection Agency, 2019).
17. Green, S. The Irish Hedge Map version 1.0. (Teagasc, 2011).
18. Water quality in 2020: An indicators report. (Environmental Protection Agency, 2021).
19. River Basin Management Plan 2018-2021. (Department of Housing, Planning and Local Government, 2018).
Go to the next chapter: Background Notes
Learn about our data and confidentiality safeguards, and the steps we take to produce statistics that can be trusted by all.