
Output at basic prices covers the value of all goods produced for sale, including unsold goods, and all receipts for services rendered. Output furthermore covers the market equivalent of goods and services produced for own use, such as own account capital formation, services of owner-occupied dwellings and agricultural products produced by farmers for own consumption. For more information see the Background Notes.
The following set of four treemap charts illustrate the proportional composition of the total by each A21 sector in a particular year (1995, 2005, 2010, 2021). Clicking on a treemap enlarges the image and offers options to look at the four treemaps as a slideshow, allowing for comparisons over time. The value and rank of each A21 sector are also provided in the tables below. This structure is repeated across each Output method thematic Chapter. Further details on the composition of the A21 and A10 sectors are provided in the charts and tables and in the Background Notes.
When examined by A21 sector, Manufacturing (C) and Information & Communication (J) were the two largest sectors by Output in both 1995 and 2021. Construction (F), the fourth largest sector by Output in 1995, increased to the second largest in 2005. Construction (F) then declined to the tenth largest sector by Output in 2010 before recovering to the eighth largest in 2021. Agriculture, Forestry and Fishing (A) declined from the sixth biggest sector by Output in 1995 to the fourteenth biggest in 2005 and the thirteenth biggest in 2021.
Figure 2.1 Proportional composition of Output by A21 sector, 1995-2021
(click on the thumbnail images below to expand these treemaps and view as a slideshow)
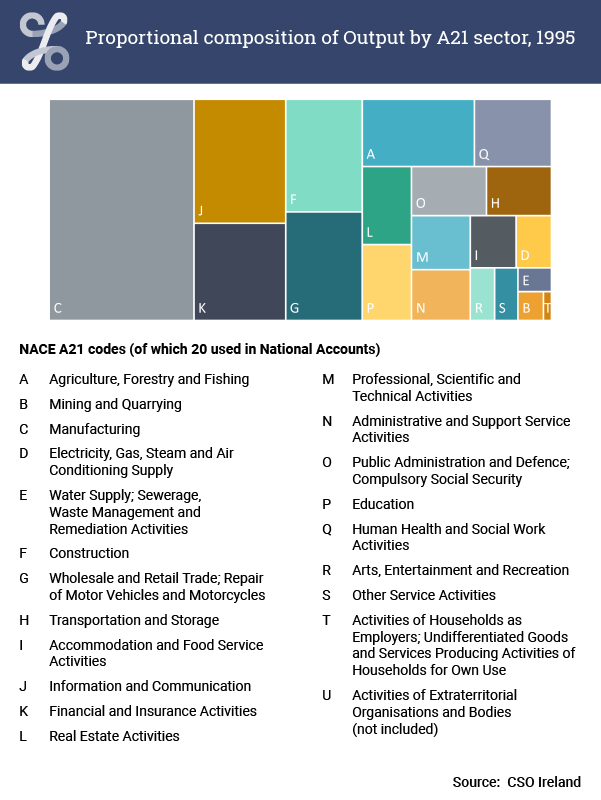
Proportional composition of Output by A21 sector, 1995
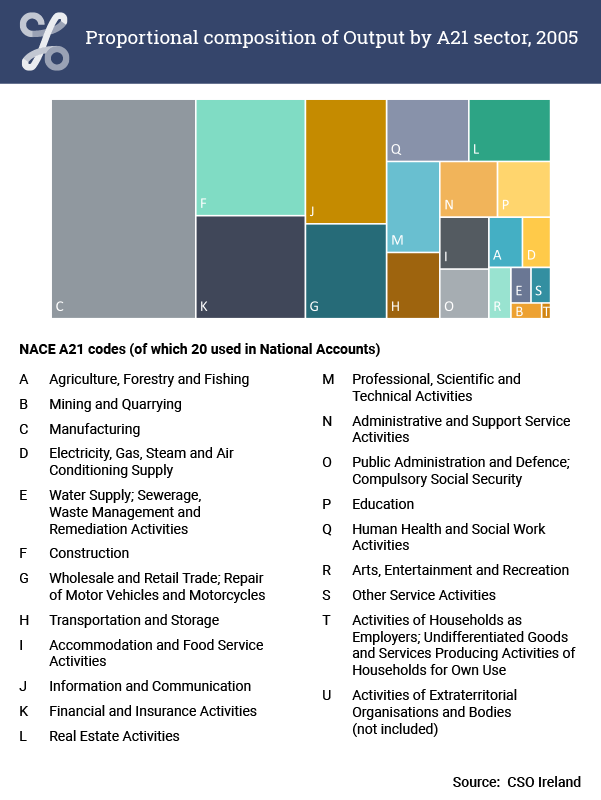
Proportional composition of Output by A21 sector, 2005
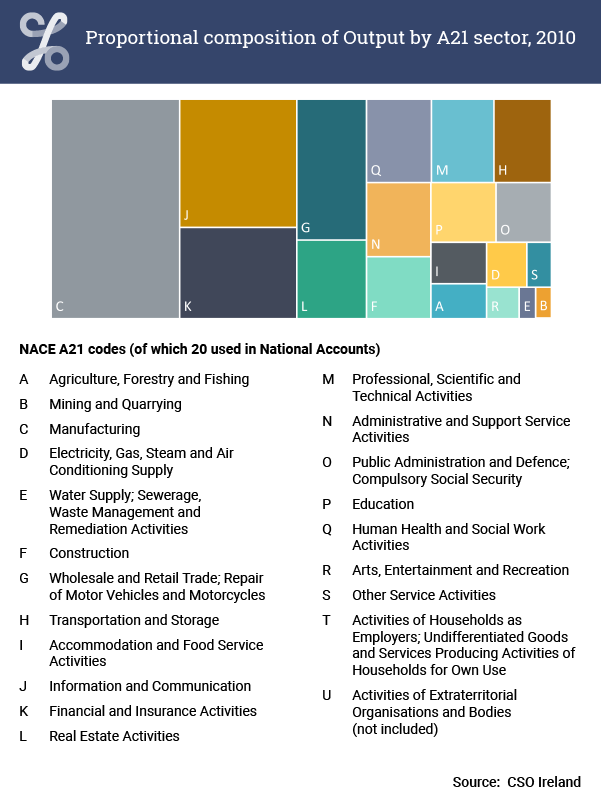
Proportional composition of Output by A21 sector, 2010
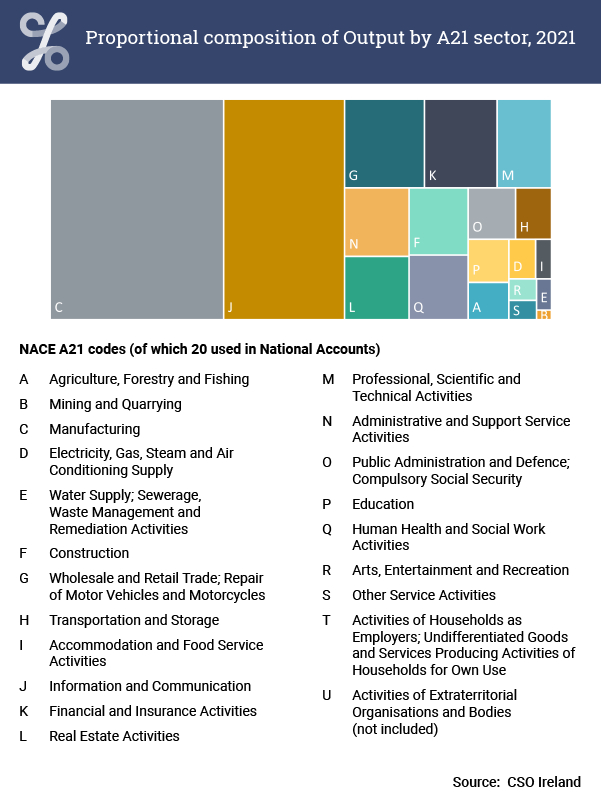
Proportional composition of Output by A21 sector, 2021
| X-axis label | Manufacturing | Construction | Information and Communication | Other |
|---|---|---|---|---|
| 1995 | 28.8328116745696 | 7.75857531279398 | 10.2326017906501 | 53.1760112219863 |
| 1996 | 29.0081368143962 | 7.8412454725757 | 10.5181715443555 | 52.6324461686726 |
| 1997 | 30.4668434305113 | 7.94799295961221 | 11.4777297038297 | 50.1074339060468 |
| 1998 | 31.7718781567594 | 8.20985166781102 | 11.2633862346727 | 48.7548839407569 |
| 1999 | 32.0361786681424 | 8.81267791758494 | 11.9763768234132 | 47.1747665908595 |
| 2000 | 31.6135954487924 | 9.39381610692413 | 11.0165984950922 | 47.9759899491912 |
| 2001 | 34.184010161324 | 9.64722341467777 | 10.0719164649885 | 46.0968499590097 |
| 2002 | 33.9846717053601 | 9.62385485055712 | 9.37589353687365 | 47.0155799072091 |
| 2003 | 31.723650140718 | 9.86379540407088 | 9.36133089548077 | 49.0512235597303 |
| 2004 | 30.2504068507744 | 10.9619986987644 | 8.47089917146656 | 50.3166952789947 |
| 2005 | 28.9525624709343 | 11.6552140662502 | 9.2330584641906 | 50.1591649986249 |
| 2006 | 27.7594694210859 | 12.3980025011773 | 9.30068902849276 | 50.5418390492441 |
| 2007 | 26.2390989288766 | 11.8886383767766 | 8.84713945710181 | 53.0251232372449 |
| 2008 | 25.1816301612487 | 9.78545445187082 | 10.2448890881027 | 54.7880262987778 |
| 2009 | 28.0048058891603 | 4.49401574040889 | 11.5151410735045 | 55.9860372969264 |
| 2010 | 25.6875640254882 | 3.64194349643662 | 13.6814148383897 | 56.9890776396855 |
| 2011 | 28.5019655931011 | 2.93992116274289 | 13.3591524203689 | 55.1989608237871 |
| 2012 | 27.8601791934997 | 2.03823817580636 | 16.5793909340785 | 53.5221916966154 |
| 2013 | 26.9930143382479 | 2.41915989142286 | 18.4346873693299 | 52.1531384009993 |
| 2014 | 28.330768636119 | 3.25510925176391 | 18.6835430670989 | 49.7305790450182 |
| 2015 | 37.7913818799988 | 2.95337949712403 | 16.8669875672466 | 42.3882510556305 |
| 2016 | 36.5908464705043 | 3.65295122372962 | 15.2540370120533 | 44.5021652937127 |
| 2017 | 34.7372279299963 | 4.32885395275735 | 16.5689201790589 | 44.3649979381874 |
| 2018 | 34.8088373237913 | 4.17780064945616 | 18.789988321793 | 42.2233737049595 |
| 2019 | 33.9180481259901 | 3.97225843050416 | 19.6469288360502 | 42.4627646074556 |
| 2020 | 34.4954833319465 | 3.86991831181003 | 22.0450528678691 | 39.5895454883744 |
| 2021 | 34.5985120232285 | 3.58956305305446 | 24.1173083538253 | 37.6946165698918 |
In the above figure, a version of which is repeated across each of the Output method chapters, the 1995-2021 time-series of some notable sectors of the economy are displayed. To allow for greater comparability over time the percentage contribution made by each to the total is displayed.
Manufacturing (C) was the biggest single A21 sector of the economy over the entire 1995-2021 period. Information and Communication (J) was the second biggest sector in 2021. These two sectors dominated and combined they comprised 59% of total Output across the economy in 2021, which was an increase from 39% in 1995.
Construction (F) which had lower Output than Information and Communication in 1995, increased to have higher Output than Information and Communication up to 2007, but had Output which was 15% of Information and Communication in 2021.
The Other category in the figure above is total Output less Manufacturing, Information and Communication and Construction. Sector figures can be found in the tables above and in the full 1995-2021 time series available in the CSO's PxStat database.
Learn about our data and confidentiality safeguards, and the steps we take to produce statistics that can be trusted by all.