
Gross Value Added (GVA) is conceptually the same aggregate as Gross Domestic Product (GDP). They both measure the added value generated in an economy by the production of goods and services. The difference between the two concepts is that GDP is measured after including product taxes (e.g. excise duties, non-deductible VAT, etc.) and deducting product subsidies while GVA is measured prior to adding product taxes but includes product subsidies. For more information see the Background Notes.
When GVA is examined by A21 sector, Manufacturing (C) and Information & Communication (J) were the two largest sectors in 2021. The Wholesale, Retail and Motor trade (G) was the second biggest in 1995 and the third biggest in 2021. Construction (F), the seventh largest sector by GVA in 1995 increased to the third largest in 2005, then declined to the fourteenth largest sector by GVA in 2010 before recovering to the eleventh largest in 2021. Agriculture, Forestry and Fishing (A) declined from the fifth biggest sector by GVA in 1995 to the sixteenth biggest in 2010 before recovering to the thirteenth largest in 2021.
Figure 4.1 Proportional composition of Gross Value Added (GVA) by A21 sector, 1995-2021
(click on the thumbnail images below to expand these treemaps and view as a slideshow)
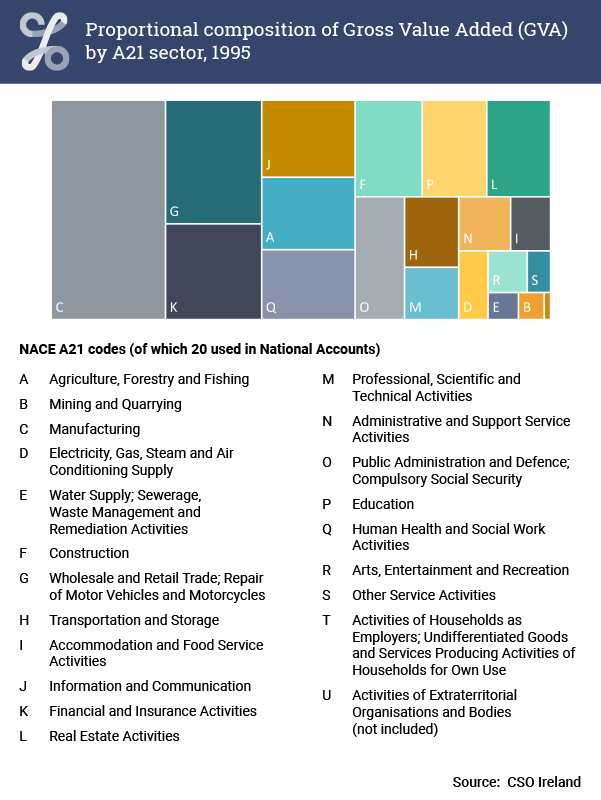
Proportional composition of Gross Value Added (GVA) by A21 sector, 1995
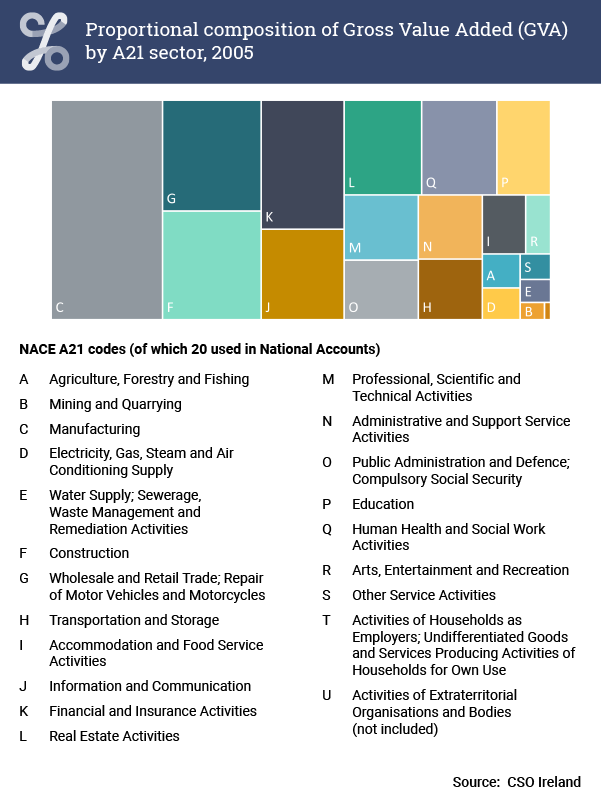
Proportional composition of Gross Value Added (GVA) by A21 sector, 2005
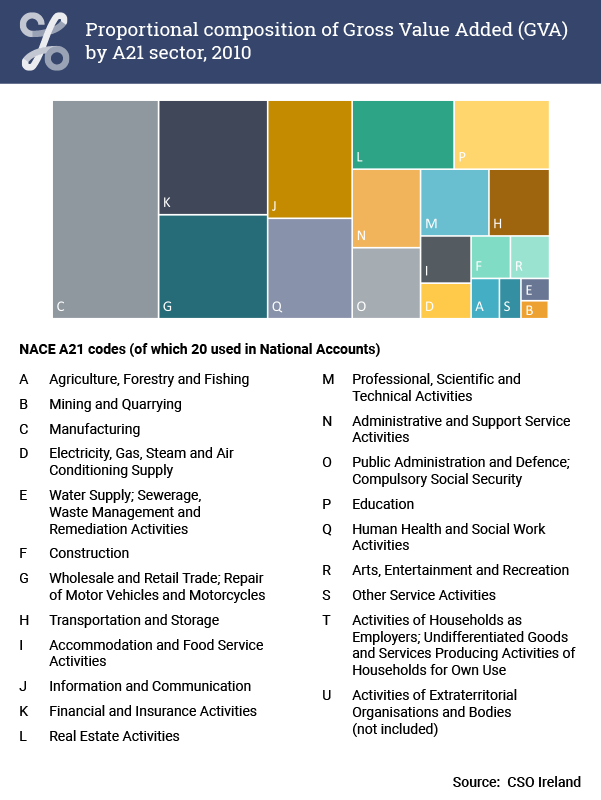
Proportional composition of Gross Value Added (GVA) by A21 sector, 2010
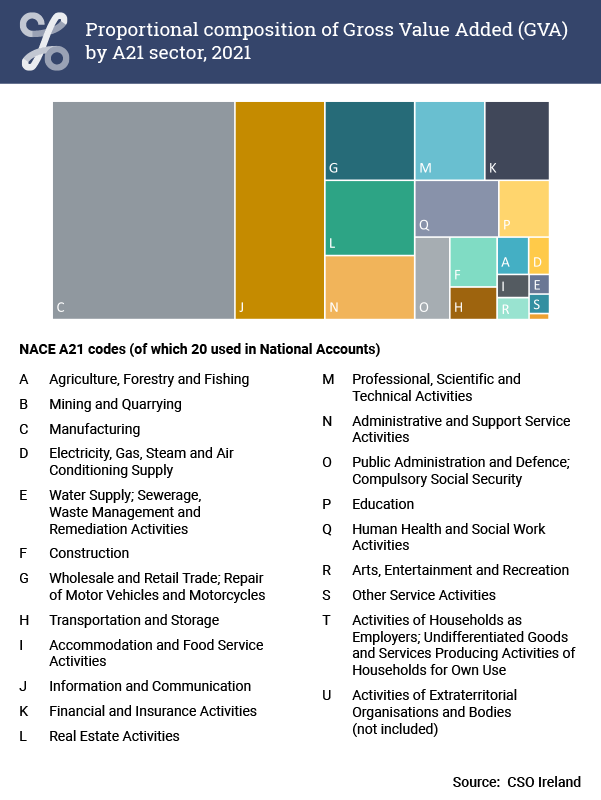
Proportional composition of Gross Value Added (GVA) by A21 sector, 2021
| Manufacturing | Construction | Information and Communication | Other | |
| 1995 | 22.9076105010899 | 5.91123062579944 | 6.57166999403468 | 64.6094888790759 |
| 1996 | 22.9722695086648 | 5.95331171816858 | 6.70048953900521 | 64.3739292341614 |
| 1997 | 24.4522819142771 | 6.08210359031634 | 7.46957159146049 | 61.9960429039461 |
| 1998 | 25.6971977706741 | 6.31820475387717 | 7.85126467593779 | 60.1333327995109 |
| 1999 | 26.4120311988435 | 6.75320135652308 | 8.36313936656416 | 58.4716280780693 |
| 2000 | 25.9333365153585 | 7.16596593228902 | 8.02744941052231 | 58.8732481418302 |
| 2001 | 28.3303704920361 | 7.42679280959067 | 7.20859501063928 | 57.0342416877339 |
| 2002 | 30.1587016139568 | 7.19023513633675 | 6.45472486643059 | 56.1963383832759 |
| 2003 | 26.3629056469601 | 7.70088407343124 | 6.54201255144665 | 59.394197728162 |
| 2004 | 24.0222686363488 | 8.69328387910384 | 6.90929036595355 | 60.3751571185938 |
| 2005 | 22.3154348792496 | 9.77912863938306 | 6.84726905738746 | 61.0581674239798 |
| 2006 | 21.1249896609325 | 10.6810172497515 | 6.3322665942993 | 61.8617264950167 |
| 2007 | 20.2316738595675 | 9.17487547991278 | 6.50161230097709 | 64.0918383595427 |
| 2008 | 19.6522886678859 | 6.60306302240437 | 7.62049778272018 | 66.1241505269895 |
| 2009 | 22.6885817025432 | 2.73769344210609 | 8.37126074887117 | 66.2024641064795 |
| 2010 | 21.4210883990981 | 1.53772374653014 | 9.19641792974079 | 67.844769924631 |
| 2011 | 22.7341064535896 | 1.08227677355927 | 9.05265854533537 | 67.1309582275158 |
| 2012 | 21.7459531687761 | 1.69624465619828 | 9.74566511858224 | 66.8121370564434 |
| 2013 | 21.0046790773819 | 2.11871055476038 | 10.2740196098464 | 66.6025907580114 |
| 2014 | 21.3492047283706 | 2.47997925672752 | 10.704084979187 | 65.4667310357148 |
| 2015 | 37.3181650461618 | 2.01030731814428 | 9.43454309909991 | 51.236984536594 |
| 2016 | 35.6544474269342 | 2.28564078043784 | 9.9389558673982 | 52.1209559252298 |
| 2017 | 34.5461975987291 | 2.72105540235494 | 11.421225520428 | 51.3115214784879 |
| 2018 | 34.9463943612228 | 2.63018803901218 | 12.9235383040443 | 49.4998792957208 |
| 2019 | 33.6738104455057 | 2.62385800614419 | 15.1637007637217 | 48.5386307846285 |
| 2020 | 36.0547204075255 | 2.32310462692678 | 17.1752762019288 | 44.4468987636189 |
| 2021 | 36.7564991365683 | 2.17159261615141 | 18.0528262874131 | 43.0190819598673 |
In the above figure, a version of which is repeated across the Output method chapters, the 1995-2021 time-series of notable sectors of the economy are displayed. To allow for greater comparability over time the percentage contribution made by each to the total is displayed.
Similarly to Output and Intermediate Consumption, Manufacturing (C) was the biggest single A21 sector of the economy when measured by GVA over the entire 1995-2021 period. Information and Communication (J) was the second biggest sector in 2021. These two sectors dominated, though not as much as for Output and Intermediate Consumption, and combined they comprised 55% of total GVA across the economy in 2021, which was an increase from 29% in 1995.
Construction (F) which had less GVA than Information and Communication in 1995, increased more than Information and Communication up to 2007, but had GVA which was 12% of Information and Communication in 2021.
The Other category in the figure above is total Output less Manufacturing, Information and Communication and Construction. Sector figures can be found in the tables above and in the full 1995-2021 time series available in the CSO's PxStat database.
Learn about our data and confidentiality safeguards, and the steps we take to produce statistics that can be trusted by all.