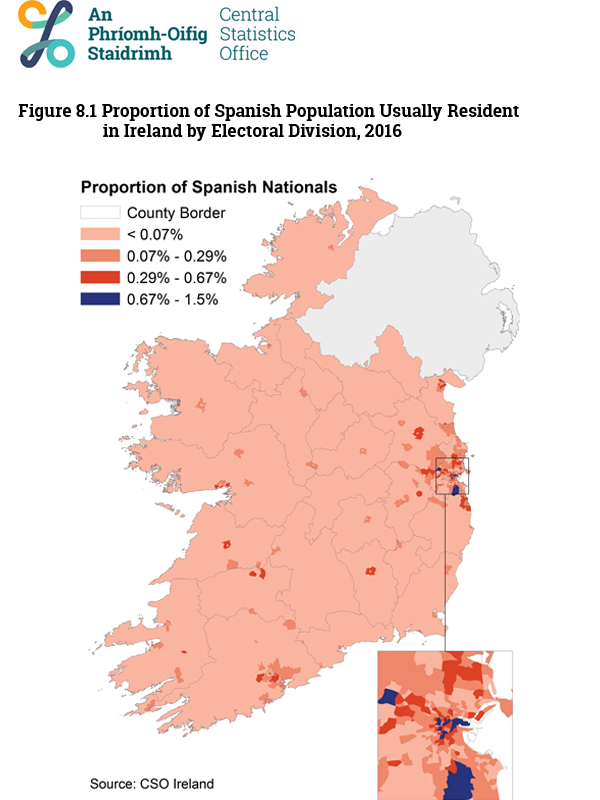
There was a 78 per cent increase in the number of Spanish nationals usually resident in Ireland between 2011 (6,794 persons) and 2016 (12,112 persons).
| Table 8.1 Population Usually Resident by Nationality and Census Year | |||
| 2006 | 2011 | 2016 | |
| Spanish | 6,052 | 6,794 | 12,112 |
It's a Fact
Over half of all Spanish nationals usually resident in Ireland were living in Dublin city and suburbs in April 2016 (6,341 persons). High concentrations of Spanish nationals can be seen in and around county Dublin, but also around Cork city and suburbs (1,185 persons) and Galway city and suburbs (474 persons).

The Spanish population living in Ireland was predominantly female (60%) in April 2016, the greatest margin between sexes of any of the nationalities profiled. There were 4,877 Spanish males living in Ireland, while there were over 7,000 Spanish females.
95 per cent of the Spanish population was aged under 50 years.
The age breakdown of Spanish and State population can be seen by clicking an option below:
| Table 8.2 Population Usually Resident in the State by Nationality, Average Age, and Census Year | |||
| 2006 | 2011 | 2016 | |
| Spanish | 30.1 | 32.1 | 32.1 |
| State | 35.5 | 36.1 | 37.3 |
The average age of the Spanish population living in Ireland remained the same between 2011 and 2016 (32.1 years), and was younger than the average age of the usually resident population in 2016 (37.3 years).
10,998 Spanish nationals were aged 15 years and over and living in Ireland in 2016, of which 76 per cent were at work (8,331 persons). The high proportion of the population at work reflected the young age profile of the population.
| Unable to work, retired or other economic status | Student or pupil | Looking after home/family | Unemployed | Persons at work | |
| State | 704262 | 415555 | 303034 | 294006 | 1970728 |
| Spanish | 193 | 1062 | 569 | 843 | 8331 |
Table 8.3 shows the top three broad industrial groups for the Spanish population at work and usually resident in Ireland in April 2016. 18 per cent of the Spanish population was at work in the information and communication industry (1,459 persons), mainly as programmers, IT support technicians, and customer service assistants.
| Table 8.3 Population Aged 15 Years and Over, at Work, by Nationality, Broad Industrial Group, and Census Year | |||
| Spanish 2011 | Spanish 2016 | State 2016 | |
| At Work | 4,494 | 8,331 | 1,970,728 |
| Information and communication activities | 16% | 18% | 4% |
| Accommodation and food service activities | 10% | 10% | 6% |
| Education | 9% | 9% | 9% |
Table 8.4 shows the top three broad occupational groups for the Spanish population at work. 26 per cent of Spanish nationals were in professional occupations, the highest proportion of any of the ten nationalities profiled to be in this type of occupation.
| Table 8.4 Population Aged 15 Years and Over, at Work, by Nationality and Broad Occupational Group, 2016 | ||
| Spanish | State | |
| At Work | 8,331 | 1,970,728 |
| Professional Occupations | 26% | 19% |
| Associate Professional and Technical Occupations | 16% | 12% |
| Caring, Leisure and other services | 11% | 8% |
60 per cent of all Spanish nationals who were in caring, leisure and other services occupations were childminders (571 persons). Furthermore, these Spanish nationals accounted for 3 per cent of all childminders in the State.
Overall, 68 per cent of the Spanish population usually resident in Ireland, aged 15 years and over, was single (7,469 persons), the highest proportion of all nationalities profiled (Figure 1.7). 85 per cent of all Spanish nationals aged 25 years to 34 years old were single in April 2016 compared with 69 per cent of all 25 to 34-year-olds in the State.
| Spanish | State | |
| Under 25 years | 98 | 99 |
| 25 - 34 years old | 85 | 69 |
| 35 - 49 years old | 49 | 29 |
| 50 - 64 years old | 24 | 15 |
| 65 years and over | 15 | 13 |
It's a Fact
Learn about our data and confidentiality safeguards, and the steps we take to produce statistics that can be trusted by all.