
| All Industries | ||
| Changes in Stocks held | ||
| Q3 2012 | Q4 2012 | |
| €m | €m | |
| Materials & Fuel | 89.7 | 118.3 |
| Finished Goods | -4.7 | -294.4 |
| Work-in-Progress | -146.2 | 68.4 |
| Goods Purchased for Resale | 79.2 | 4.8 |
| Total Stocks | 18.0 | -102.9 |
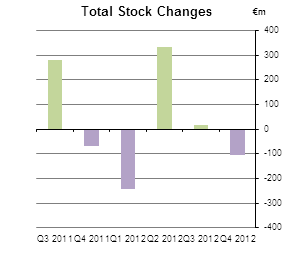
The value of total stocks held by industry fell by €102.9m in the fourth quarter of 2012, following an increase of €18.0m in the third quarter of 2012.
The principal reason for the fourth quarter change in the value of stocks was a decrease of €294.4m in Finished Goods. Materials & Fuel stocks increased by €118.3m while Work-in-Progress stocks also showed an increase of €68.4m. The main sectors contributing to the rise in the value of stocks were:
| Table 1 Change in value of total stocks held in industry (€ million) | ||||||||||||||
| NACE Rev 2 Code | Description | CIP closing level 2010 | 2011 | Closing level 2011 | 2012 | Closing level 2012 | ||||||||
| Q1 | Q2 | Q3 | Q4 | Year | Q1 | Q2 | Q3 | Q41 | Year1 | |||||
| 10 | Food Products | 1,091.4 | 112.0 | 85.1 | 63.7 | -107.4 | 153.4 | 1,244.8 | -7.1 | 31.7 | 159.9 | -141.5 | 43.1 | 1,287.9 |
| 11 | Beverages | 350.6 | 16.9 | -3.9 | 52.5 | -32.3 | 33.1 | 383.8 | 9.3 | -11.5 | 28.2 | 3.2 | 29.1 | 412.8 |
| 13 | Textiles | 41.0 | 3.4 | 3.5 | 0.0 | 0.0 | 6.9 | 47.9 | 3.3 | -1.0 | -0.2 | -2.9 | -0.7 | 47.2 |
| 14 | Wearing apparel | 21.7 | 0.1 | 0.1 | 0.2 | 0.1 | 0.5 | 22.2 | 0.0 | -0.2 | 0.3 | -0.4 | -0.3 | 21.8 |
| 16 | Wood and wood products, except furniture | 90.7 | 6.3 | 2.9 | 0.2 | 4.5 | 13.9 | 104.6 | -1.5 | -1.5 | -6.2 | 0.4 | -8.8 | 95.8 |
| 17 | Paper and paper products | 33.5 | 2.0 | 5.0 | -2.8 | -5.7 | -1.5 | 32.0 | 2.1 | 2.1 | -1.6 | -3.0 | -0.3 | 31.7 |
| 18 | Printing and reproduction of recorded media | 28.3 | -6.5 | -2.6 | 1.4 | 2.0 | -5.7 | 22.6 | 8.8 | 5.3 | 8.4 | -5.0 | 17.4 | 40.1 |
| 20 | Chemicals and chemical products | 352.6 | -27.8 | -35.3 | 28.4 | 65.6 | 30.9 | 383.5 | -45.9 | -3.0 | -8.5 | 47.3 | -10.0 | 373.4 |
| 21 | Basic pharmaceutical products and preparations | 3,619.8 | 111.4 | -51.2 | 123.8 | 90.6 | 274.6 | 3,894.5 | -175.9 | 209.6 | -245.6 | 81.3 | -130.6 | 3,763.9 |
| 22 | Rubber and plastic products | 137.2 | 15.1 | 4.1 | -4.9 | -12.4 | 1.9 | 139.1 | 8.4 | -0.7 | 5.0 | -0.9 | 11.8 | 150.9 |
| 23 | Other non-metallic mineral products | 184.1 | 22.2 | -11.0 | -14.1 | -16.4 | -19.3 | 164.8 | 24.2 | -15.0 | -19.3 | -11.0 | -21.2 | 143.6 |
| 24 | Basic metals | 70.5 | 5.8 | 1.3 | -2.9 | 0.7 | 4.9 | 75.4 | 12.3 | 0.8 | -2.0 | -0.5 | 10.6 | 86.0 |
| 25 | Fabricated metal products, except machinery and equipment | 180.2 | 9.0 | 8.9 | -7.8 | -21.7 | -11.5 | 168.7 | 10.0 | 14.6 | -6.5 | -16.1 | 2.0 | 170.7 |
| 26 | Computer, electronic and optical products | 655.9 | 76.5 | 26.8 | 5.3 | -47.2 | 61.3 | 717.2 | -13.8 | 30.2 | 66.6 | -39.1 | 43.8 | 761.0 |
| 27 | Electrical equipment | 60.5 | 5.8 | 0.1 | -4.1 | 0.2 | 2.0 | 62.5 | -1.7 | 3.9 | 1.3 | 0.8 | 4.3 | 66.8 |
| 28 | Machinery and equipment n.e.c. | 267.9 | -1.1 | 11.3 | 19.0 | -11.8 | 17.4 | 285.3 | 11.7 | 12.6 | 2.4 | 7.3 | 34.0 | 319.3 |
| 29, 30 | Transport equipment | 201.5 | -1.9 | -7.2 | -3.5 | 2.5 | -10.1 | 191.5 | -17.4 | -3.0 | 17.1 | -10.1 | -13.4 | 178.0 |
| 32 | Other manufacturing | 583.0 | 21.5 | 33.9 | 22.7 | -5.7 | 72.3 | 655.3 | 1.9 | -2.6 | -33.3 | -18.3 | -52.3 | 603.0 |
| 33 | Repair and installation of machinery and equipment | 47.6 | 2.5 | 0.5 | 6.2 | 0.8 | 10.0 | 57.6 | 3.5 | 6.4 | -4.5 | 2.4 | 7.8 | 65.4 |
| 12, 15, 19, 31 | Tobacco, leather, coke and refined petroleum products, furniture | 177.6 | -18.3 | 31.9 | -29.2 | 45.3 | 29.8 | 207.4 | -31.2 | 37.7 | 15.8 | 36.4 | 58.6 | 266.0 |
| 10 to 33 | Manufacturing Industries | 8,195.8 | 355.0 | 104.1 | 254.0 | -48.3 | 664.8 | 8,860.6 | -199.0 | 316.4 | -22.9 | -69.6 | 24.8 | 8,885.4 |
| 05 to 09 | Mining and quarrying | 134.2 | -22.0 | 22.6 | 29.9 | -27.1 | 3.5 | 137.7 | -9.8 | -1.0 | 13.5 | -23.9 | -21.2 | 116.5 |
| 05 to 33 | Transportable Goods Industries | 8,329.9 | 333.1 | 126.7 | 283.9 | -75.4 | 668.3 | 8,998.2 | -208.8 | 315.4 | -9.5 | -93.5 | 3.6 | 9,001.8 |
| 35 | Electricity, gas, steam and air-conditioning supply | 180.7 | 8.1 | 33.4 | -6.5 | 14.3 | 49.2 | 229.8 | -35.2 | 23.7 | 26.7 | -7.0 | 8.2 | 238.0 |
| 36 to 39 | Water supply, sewerage and waste management | 31.5 | -0.2 | 0.3 | 1.4 | -6.7 | -5.1 | 26.4 | 2.4 | -4.9 | 0.7 | -2.4 | -4.2 | 22.2 |
| 05 to 39 | Industries | 8,542.1 | 341.0 | 160.4 | 278.9 | -67.8 | 712.4 | 9,254.4 | -241.6 | 334.2 | 18.0 | -102.9 | 7.6 | 9,262.0 |
| 1 Preliminary estimates | ||||||||||||||
| Table 2 Change in value of stocks of materials and fuel held in industry (€ million) | ||||||||||||||
| NACE Rev 2 Code | Description | CIP closing level 2010 | 2011 | Closing level 2011 | 2012 | Closing level 2012 | ||||||||
| Q1 | Q2 | Q3 | Q4 | Year | Q1 | Q2 | Q3 | Q41 | Year1 | |||||
| 10 | Food Products | 428.4 | 4.6 | -3.1 | 8.7 | 24.7 | 34.9 | 463.3 | -10.0 | -14.5 | 43.9 | 44.2 | 63.5 | 526.8 |
| 11 | Beverages | 56.6 | -11.6 | -8.4 | 4.8 | 6.0 | -9.2 | 47.4 | -5.1 | -9.0 | 9.0 | 18.1 | 12.9 | 60.3 |
| 13 | Textiles | 18.0 | 0.2 | 1.3 | 2.1 | -0.3 | 3.3 | 21.3 | 2.4 | -1.2 | 0.2 | -2.7 | -1.3 | 19.9 |
| 14 | Wearing apparel | 9.4 | -0.2 | 0.1 | 0.2 | 0.0 | 0.0 | 9.4 | 0.0 | -0.1 | 0.1 | -0.1 | -0.2 | 9.2 |
| 16 | Wood and wood products, except furniture | 40.8 | 0.8 | 0.7 | -0.4 | 3.8 | 4.9 | 45.7 | -3.3 | 3.2 | -2.8 | -0.1 | -3.0 | 42.7 |
| 17 | Paper and paper products | 17.2 | 1.2 | 1.7 | -0.1 | -3.3 | -0.5 | 16.7 | 1.0 | 0.9 | 0.4 | -1.0 | 1.4 | 18.1 |
| 18 | Printing and reproduction of recorded media | 14.3 | -7.1 | 1.2 | 0.1 | -0.3 | -6.2 | 8.1 | 2.5 | 1.7 | 0.5 | -2.4 | 2.4 | 10.4 |
| 20 | Chemicals and chemical products | 139.7 | -13.2 | -21.1 | 18.3 | 22.7 | 6.7 | 146.4 | -13.5 | -9.7 | 8.4 | 13.4 | -1.4 | 145.0 |
| 21 | Basic pharmaceutical products and preparations | 921.2 | -39.5 | -107.4 | 14.7 | -49.7 | -181.9 | 739.3 | 11.8 | -3.9 | -12.7 | 29.5 | 24.6 | 763.9 |
| 22 | Rubber and plastic products | 73.2 | 11.0 | 3.6 | -0.6 | -9.7 | 4.3 | 77.6 | 2.7 | 1.7 | 4.6 | -2.8 | 6.1 | 83.7 |
| 23 | Other non-metallic mineral products | 89.0 | 18.3 | -6.3 | -6.2 | -3.5 | 2.4 | 91.3 | 18.0 | -1.0 | -17.4 | -3.8 | -4.3 | 87.0 |
| 24 | Basic metals | 40.5 | 1.6 | 1.4 | 1.6 | 1.3 | 5.8 | 46.4 | 1.7 | 1.6 | -0.1 | 0.0 | 3.3 | 49.6 |
| 25 | Fabricated metal products, except machinery and equipment | 88.0 | 1.3 | 6.1 | -6.1 | 0.4 | 1.6 | 89.6 | 0.1 | -0.7 | 0.7 | -11.3 | -11.1 | 78.5 |
| 26 | Computer, electronic and optical products | 159.7 | 43.5 | 11.3 | -2.6 | -19.2 | 33.1 | 192.8 | 2.1 | 7.0 | 11.5 | -12.4 | 8.2 | 201.0 |
| 27 | Electrical equipment | 31.9 | 1.1 | 2.1 | -4.0 | -1.5 | -2.2 | 29.7 | -0.3 | 2.8 | 1.0 | -2.4 | 1.1 | 30.7 |
| 28 | Machinery and equipment n.e.c. | 137.3 | -7.7 | 8.8 | 15.5 | -4.0 | 12.5 | 149.9 | 2.5 | 2.6 | 3.0 | 7.0 | 15.1 | 164.9 |
| 29, 30 | Transport equipment | 72.9 | -4.6 | -3.8 | 0.7 | 8.4 | 0.7 | 73.6 | -6.3 | 1.3 | 0.6 | 7.7 | 3.3 | 77.0 |
| 32 | Other manufacturing | 220.0 | 6.7 | 6.3 | 4.4 | -3.2 | 14.1 | 234.1 | -10.1 | 23.8 | -4.7 | 6.7 | 15.7 | 249.8 |
| 33 | Repair and installation of machinery and equipment | 25.4 | 0.8 | -0.9 | 1.3 | 0.5 | 1.8 | 27.2 | 0.4 | 3.0 | 0.4 | 4.9 | 8.6 | 35.8 |
| 12, 15, 19, 31 | Tobacco, leather, coke and refined petroleum products, furniture | 59.2 | -19.8 | 26.3 | -24.4 | 42.9 | 25.1 | 84.2 | -31.7 | 36.9 | 16.4 | 37.0 | 58.6 | 142.8 |
| 10 to 33 | Manufacturing Industries | 2,642.6 | -12.5 | -80.1 | 27.8 | 16.0 | -48.8 | 2,593.8 | -35.3 | 46.3 | 63.1 | 129.5 | 203.6 | 2,797.4 |
| 05 to 09 | Mining and quarrying | 33.5 | -2.6 | -1.3 | 5.7 | -7.4 | -5.7 | 27.9 | 9.6 | 0.5 | 0.5 | -2.9 | 7.7 | 35.6 |
| 05 to 33 | Transportable Goods Industries | 2,676.1 | -15.2 | -81.4 | 33.5 | 8.6 | -54.5 | 2,621.6 | -25.7 | 46.8 | 63.6 | 126.6 | 211.3 | 2,833.0 |
| 35 | Electricity, gas, steam and air-conditioning supply | 166.8 | 8.1 | 33.4 | -6.5 | 13.1 | 48.0 | 214.8 | -35.2 | 24.3 | 25.9 | -6.7 | 8.3 | 223.1 |
| 36 to 39 | Water supply, sewerage and waste management | 19.7 | -0.3 | 1.8 | -0.5 | -6.3 | -5.3 | 14.4 | -0.7 | 0.0 | 0.1 | -1.5 | -2.2 | 12.3 |
| 05 to 39 | Industries | 2,862.6 | -7.4 | -46.2 | 26.5 | 15.4 | -11.7 | 2,850.9 | -61.6 | 71.1 | 89.7 | 118.3 | 217.5 | 3,068.4 |
| 1 Preliminary estimates | ||||||||||||||
| Table 3 Change in value of finished goods held in industry (€ million) | ||||||||||||||
| Closing level 2011 | ||||||||||||||
| NACE Rev 2 Code | Description | CIP closing level 2010 | 2011 | 2012 | Closing level 2012 | |||||||||
| Q1 | Q2 | Q3 | Q4 | Year | Q1 | Q2 | Q3 | Q41 | Year1 | |||||
| 10 | Food Products | 553.6 | 86.0 | 94.8 | 35.0 | -127.0 | 88.8 | 642.4 | -19.9 | 56.2 | 101.1 | -192.5 | -55.1 | 587.3 |
| 11 | Beverages | 47.6 | 15.6 | -5.5 | 21.8 | -25.1 | 6.8 | 54.4 | 7.0 | -6.4 | 25.9 | -11.1 | 15.3 | 69.7 |
| 13 | Textiles | 15.2 | 0.7 | 0.0 | -1.6 | 1.0 | 0.1 | 15.3 | 0.1 | 1.8 | -0.7 | 0.8 | 2.0 | 17.4 |
| 14 | Wearing apparel | 4.6 | 0.2 | 0.0 | -0.1 | 0.1 | 0.1 | 4.7 | 0.0 | 0.1 | 0.1 | -0.2 | -0.1 | 4.7 |
| 16 | Wood and wood products, except furniture | 34.2 | 0.4 | 2.2 | 0.5 | 2.5 | 5.6 | 39.8 | -1.6 | -2.0 | -3.7 | 0.6 | -6.7 | 33.1 |
| 17 | Paper and paper products | 10.1 | 0.4 | 1.0 | -2.0 | -1.3 | -1.8 | 8.2 | 0.6 | 1.6 | -0.9 | -1.4 | -0.1 | 8.1 |
| 18 | Printing and reproduction of recorded media | 5.3 | 1.3 | -2.0 | -0.3 | 2.6 | 1.6 | 6.9 | 4.7 | 4.2 | 5.6 | -5.2 | 9.4 | 16.3 |
| 20 | Chemicals and chemical products | 125.1 | -2.5 | -2.0 | -4.6 | 13.4 | 4.3 | 129.4 | -27.6 | 21.0 | 5.9 | 14.4 | 13.6 | 143.1 |
| 21 | Basic pharmaceutical products and preparations | 1,248.9 | 46.2 | 32.1 | 18.2 | -18.2 | 78.3 | 1,327.3 | 123.3 | 40.6 | -102.4 | -64.3 | -2.8 | 1,324.4 |
| 22 | Rubber and plastic products | 51.5 | 1.2 | -0.6 | -1.8 | -0.9 | -2.1 | 49.4 | 4.0 | -2.7 | 0.5 | 2.3 | 4.0 | 53.4 |
| 23 | Other non-metallic mineral products | 65.7 | 2.9 | 2.4 | -0.1 | -7.4 | -2.1 | 63.5 | 5.9 | 2.8 | -7.5 | -6.4 | -5.3 | 58.3 |
| 24 | Basic metals | 11.7 | 2.8 | 2.4 | -3.5 | -1.3 | 0.4 | 12.2 | 4.1 | -0.2 | -1.9 | 0.0 | 2.0 | 14.2 |
| 25 | Fabricated metal products, except machinery and equipment | 31.3 | 4.4 | 2.8 | 0.3 | -2.2 | 5.3 | 36.6 | -2.4 | 0.2 | -2.3 | -3.2 | -7.8 | 28.9 |
| 26 | Computer, electronic and optical products | 261.2 | -13.8 | 11.7 | -6.2 | -0.6 | -8.9 | 252.3 | -7.3 | -1.1 | 1.7 | 0.7 | -5.9 | 246.4 |
| 27 | Electrical equipment | 16.7 | 0.8 | 1.5 | -2.0 | 1.2 | 1.5 | 18.1 | -1.1 | 0.9 | -1.2 | 0.8 | -0.6 | 17.5 |
| 28 | Machinery and equipment n.e.c. | 61.1 | 4.6 | -1.1 | 4.6 | -0.5 | 7.4 | 68.5 | 12.0 | 0.5 | -0.8 | 4.0 | 15.7 | 84.2 |
| 29, 30 | Transport equipment | 95.6 | -11.8 | -2.3 | -3.4 | -1.3 | -18.8 | 76.8 | -9.1 | -6.6 | 3.3 | -4.8 | -17.2 | 59.6 |
| 32 | Other manufacturing | 201.5 | 6.7 | 17.4 | 12.8 | 3.0 | 39.9 | 241.4 | 0.8 | -17.8 | -29.0 | -19.1 | -65.1 | 176.3 |
| 33 | Repair and installation of machinery and equipment | 5.5 | 0.0 | 0.3 | 1.2 | -1.0 | 0.5 | 6.0 | 0.3 | 0.3 | -1.2 | -0.8 | -1.4 | 4.5 |
| 12, 15, 19, 31 | Tobacco, leather, coke and refined petroleum products, furniture | 96.5 | 0.2 | 2.5 | -0.4 | 2.1 | 4.4 | 101.0 | 0.3 | 0.4 | 0.0 | -1.8 | -1.2 | 99.8 |
| 10 to 33 | Manufacturing Industries | 2,942.9 | 146.5 | 157.6 | 68.3 | -160.9 | 211.4 | 3,154.2 | 94.0 | 93.6 | -7.6 | -287.2 | -107.2 | 3,047.1 |
| 05 to 09 | Mining and quarrying | 76.9 | -15.7 | 11.7 | 11.6 | -6.8 | 0.8 | 77.7 | -12.4 | -0.3 | 1.3 | -6.2 | -17.6 | 60.0 |
| 05 to 33 | Transportable Goods Industries | 3,019.7 | 130.7 | 169.3 | 79.9 | -167.8 | 212.2 | 3,231.9 | 81.6 | 93.3 | -6.3 | -293.4 | -124.8 | 3,107.1 |
| 35 | Electricity, gas, steam and air-conditioning supply | 3.0 | 0.0 | 0.0 | 0.0 | 0.0 | 0.0 | 3.0 | 0.0 | 0.0 | 0.0 | 0.0 | 0.0 | 3.0 |
| 36 to 39 | Water supply, sewerage and waste management | 9.9 | 3.6 | 0.1 | 1.1 | -1.0 | 3.8 | 13.8 | 1.6 | -1.9 | 1.5 | -1.0 | 0.2 | 14.0 |
| 05 to 39 | Industries | 3,032.7 | 134.4 | 169.4 | 81.0 | -168.8 | 216.0 | 3,248.7 | 83.2 | 91.4 | -4.7 | -294.4 | -124.6 | 3,124.1 |
| 1 Preliminary estimates | ||||||||||||||
| Table 4 Change in value of stocks of work-in-progress goods held in industry (€ million) | ||||||||||||||
| NACE Rev 2 Code | Description | CIP closing level 2010 | 2011 | Closing level 2011 | 2012 | Closing level 2012 | ||||||||
| Q1 | Q2 | Q3 | Q4 | Year | Q1 | Q2 | Q3 | Q41 | Year1 | |||||
| 10 | Food Products | 58.8 | 8.8 | 0.6 | -1.3 | -11.1 | -3.0 | 55.8 | 8.1 | 5.2 | 2.8 | -7.6 | 8.5 | 64.3 |
| 11 | Beverages | 216.0 | 13.2 | 8.5 | 3.0 | 10.0 | 34.7 | 250.6 | 9.2 | 7.9 | -3.2 | -0.8 | 13.0 | 263.7 |
| 13 | Textiles | 3.6 | 1.8 | 0.6 | -0.6 | -1.3 | 0.5 | 4.0 | 1.1 | -0.2 | -0.3 | -0.4 | 0.1 | 4.1 |
| 14 | Wearing apparel | 1.9 | 0.1 | 0.0 | 0.1 | 0.0 | 0.3 | 2.2 | -0.1 | -0.1 | 0.2 | -0.1 | -0.1 | 2.1 |
| 16 | Wood and wood products, except furniture | 7.4 | 3.7 | 0.2 | -0.4 | -1.6 | 1.9 | 9.3 | 1.0 | 0.6 | -0.9 | -0.8 | -0.1 | 9.2 |
| 17 | Paper and paper products | 2.6 | 0.6 | 0.2 | -0.1 | -0.4 | 0.3 | 2.9 | 0.3 | -0.5 | -0.7 | -0.7 | -1.6 | 1.4 |
| 18 | Printing and reproduction of recorded media | 6.8 | -0.9 | -1.4 | 1.7 | -0.3 | -1.0 | 5.8 | 1.6 | -0.7 | -1.1 | -0.4 | -0.6 | 5.2 |
| 20 | Chemicals and chemical products | 80.8 | 2.1 | -1.9 | 0.9 | 7.4 | 8.5 | 89.2 | 4.4 | 2.1 | -22.2 | 1.1 | -14.6 | 74.6 |
| 21 | Basic pharmaceutical products and preparations | 1,442.7 | 108.9 | 24.1 | 89.5 | 158.6 | 381.1 | 1,823.7 | -311.7 | 170.1 | -131.8 | 115.1 | -158.2 | 1,665.5 |
| 22 | Rubber and plastic products | 7.2 | 2.4 | 1.2 | -2.1 | -0.7 | 0.8 | 7.9 | 0.2 | -0.1 | -0.1 | -0.5 | -0.5 | 7.5 |
| 23 | Other non-metallic mineral products | 20.4 | -2.6 | -4.1 | -6.6 | -5.3 | -18.5 | 1.9 | -0.4 | -6.0 | 5.1 | 0.5 | -0.8 | 1.2 |
| 24 | Basic metals | 16.0 | 2.7 | -2.4 | -0.3 | 1.1 | 1.1 | 17.0 | 3.6 | 0.1 | -0.2 | 0.3 | 3.8 | 20.9 |
| 25 | Fabricated metal products, except machinery and equipment | 55.0 | 2.5 | -2.2 | -2.2 | -21.6 | -23.6 | 31.4 | 6.9 | 6.9 | -5.7 | -6.8 | 1.2 | 32.7 |
| 26 | Computer, electronic and optical products | 229.0 | -24.6 | -9.5 | -5.0 | -20.6 | -59.7 | 169.3 | -6.9 | 17.9 | 1.3 | -2.8 | 9.5 | 178.8 |
| 27 | Electrical equipment | 11.3 | 4.2 | -3.4 | 0.2 | -0.7 | 0.3 | 11.6 | -0.4 | 0.5 | -0.6 | -2.5 | -3.0 | 8.6 |
| 28 | Machinery and equipment n.e.c. | 57.0 | 3.8 | 4.9 | -2.4 | -5.5 | 0.7 | 57.7 | -2.9 | 6.1 | 1.3 | -2.7 | 1.7 | 59.4 |
| 29, 30 | Transport equipment | 25.0 | 7.2 | -0.4 | -0.9 | -4.1 | 1.7 | 26.7 | -1.2 | 1.8 | 13.0 | -12.1 | 1.5 | 28.3 |
| 32 | Other manufacturing | 148.8 | 2.4 | 8.4 | 8.8 | -2.7 | 16.9 | 165.8 | 10.3 | -0.2 | 3.5 | -7.0 | 6.6 | 172.3 |
| 33 | Repair and installation of machinery and equipment | 11.6 | 1.0 | 1.0 | 4.0 | 1.6 | 7.6 | 19.2 | 2.1 | 3.0 | -3.5 | -1.3 | 0.2 | 19.4 |
| 12, 15, 19, 31 | Tobacco, leather, coke and refined petroleum products, furniture | 17.8 | 0.6 | 1.7 | -4.3 | -1.1 | -3.1 | 14.7 | 0.1 | -0.5 | -0.3 | -0.6 | -1.3 | 13.4 |
| 10 to 33 | Manufacturing Industries | 2,419.5 | 137.9 | 25.8 | 81.9 | 101.7 | 347.4 | 2,766.9 | -274.6 | 214.1 | -143.7 | 69.8 | -134.4 | 2,632.5 |
| 05 to 09 | Mining and quarrying | 12.7 | -2.2 | -2.3 | 1.7 | 0.7 | -2.0 | 10.7 | 4.8 | -4.9 | -1.2 | -1.4 | -2.7 | 8.0 |
| 05 to 33 | Transportable Goods Industries | 2,432.3 | 135.8 | 23.5 | 83.6 | 102.5 | 345.3 | 2,777.6 | -269.8 | 209.2 | -144.9 | 68.4 | -137.2 | 2,640.4 |
| 35 | Electricity, gas, steam and air-conditioning supply | 1.2 | 0.0 | 0.0 | 0.0 | 0.0 | 0.0 | 1.2 | 0.0 | 0.0 | 0.0 | 0.0 | 0.0 | 1.2 |
| 36 to 39 | Water supply, sewerage and waste management | 0.8 | -4.1 | -1.9 | 0.4 | -1.0 | -6.7 | -5.8 | 0.9 | -3.7 | -1.3 | 0.0 | -4.1 | -9.9 |
| 05 to 39 | Industries | 2,434.3 | 131.7 | 21.6 | 83.9 | 101.4 | 338.7 | 2,773.0 | -268.9 | 205.5 | -146.2 | 68.4 | -141.2 | 2,631.7 |
| 1 Preliminary estimates | ||||||||||||||
| Table 5 Change in value of stocks of goods purchased for resale held in industry (€ million) | ||||||||||||||
| NACE Rev 2 Code | Description | CIP closing level 2010 | 2011 | Closing level 2011 | 2012 | Closing level 2012 | ||||||||
| Q1 | Q2 | Q3 | Q4 | Year | Q1 | Q2 | Q3 | Q41 | Year1 | |||||
| 10 | Food Products | 50.6 | 12.6 | -7.2 | 21.2 | 5.9 | 32.6 | 83.2 | 14.7 | -15.1 | 12.2 | 14.5 | 26.2 | 109.5 |
| 11 | Beverages | 30.5 | -0.2 | 1.5 | 22.9 | -23.3 | 0.8 | 31.3 | -1.7 | -4.0 | -3.5 | -3.0 | -12.2 | 19.1 |
| 13 | Textiles | 4.3 | 0.7 | 1.6 | 0.1 | 0.6 | 3.0 | 7.3 | -0.2 | -1.3 | 0.5 | -0.5 | -1.5 | 5.8 |
| 14 | Wearing apparel | 5.8 | 0.0 | 0.0 | 0.0 | 0.0 | 0.0 | 5.8 | 0.0 | 0.0 | 0.0 | 0.0 | 0.0 | 5.8 |
| 16 | Wood and wood products, except furniture | 8.4 | 1.4 | -0.2 | 0.5 | -0.2 | 1.5 | 9.8 | 2.4 | -3.3 | 1.2 | 0.7 | 0.9 | 10.8 |
| 17 | Paper and paper products | 3.6 | -0.2 | 2.1 | -0.7 | -0.7 | 0.5 | 4.1 | 0.1 | 0.1 | -0.3 | 0.1 | 0.0 | 4.1 |
| 18 | Printing and reproduction of recorded media | 2.0 | 0.2 | -0.4 | 0.0 | 0.0 | -0.1 | 1.9 | 0.0 | 0.0 | 3.4 | 2.9 | 6.3 | 8.1 |
| 20 | Chemicals and chemical products | 7.0 | -14.2 | -10.2 | 13.8 | 22.1 | 11.5 | 18.4 | -9.1 | -16.4 | -0.6 | 18.5 | -7.6 | 10.8 |
| 21 | Basic pharmaceutical products and preparations | 7.0 | -4.2 | 0.0 | 1.5 | -0.1 | -2.9 | 4.2 | 0.8 | 2.8 | 1.2 | 1.1 | 5.9 | 10.1 |
| 22 | Rubber and plastic products | 5.3 | 0.4 | -0.1 | -0.4 | -1.1 | -1.1 | 4.2 | 1.5 | 0.4 | 0.0 | 0.1 | 2.1 | 6.3 |
| 23 | Other non-metallic mineral products | 9.0 | 3.5 | -3.0 | -1.2 | -0.2 | -1.0 | 8.0 | 0.6 | -10.8 | 0.6 | -1.3 | -10.9 | -2.9 |
| 24 | Basic metals | 2.3 | -1.4 | 0.0 | -0.6 | -0.4 | -2.4 | -0.1 | 2.8 | -0.8 | 0.2 | -0.8 | 1.5 | 1.3 |
| 25 | Fabricated metal products, except machinery and equipment | 5.9 | 0.9 | 2.2 | 0.3 | 1.7 | 5.1 | 11.0 | 5.4 | 8.3 | 0.8 | 5.2 | 19.7 | 30.7 |
| 26 | Computer, electronic and optical products | 6.0 | 71.3 | 13.2 | 19.1 | -6.8 | 96.9 | 102.9 | -1.7 | 6.4 | 52.0 | -24.6 | 32.1 | 135.0 |
| 27 | Electrical equipment | 0.7 | -0.3 | 0.0 | 1.6 | 1.2 | 2.4 | 3.2 | 0.1 | -0.2 | 2.1 | 4.8 | 6.9 | 10.0 |
| 28 | Machinery and equipment n.e.c. | 12.5 | -1.7 | -1.2 | 1.4 | -1.8 | -3.3 | 9.2 | 0.2 | 3.4 | -1.2 | -1.0 | 1.5 | 10.7 |
| 29, 30 | Transport equipment | 7.9 | 7.3 | -0.7 | 0.2 | -0.5 | 6.3 | 14.3 | -0.8 | 0.4 | 0.2 | -0.8 | -1.1 | 13.2 |
| 32 | Other manufacturing | 12.7 | 5.6 | 1.8 | -3.3 | -2.7 | 1.4 | 14.1 | 1.0 | -8.5 | -3.1 | 1.1 | -9.5 | 4.6 |
| 33 | Repair and installation of machinery and equipment | 5.1 | 0.7 | 0.1 | -0.4 | -0.3 | 0.1 | 5.2 | 0.8 | 0.1 | -0.3 | -0.3 | 0.3 | 5.6 |
| 12, 15, 19, 31 | Tobacco, leather, coke and refined petroleum products, furniture | 4.2 | 0.7 | 1.3 | -0.1 | 1.4 | 3.4 | 7.6 | 0.1 | 0.8 | -0.3 | 1.8 | 2.4 | 10.0 |
| 10 to 33 | Manufacturing Industries | 190.8 | 83.2 | 0.7 | 76.1 | -5.1 | 154.8 | 345.6 | 16.9 | -37.6 | 65.2 | 18.3 | 62.8 | 408.4 |
| 05 to 09 | Mining and quarrying | 11.0 | -1.4 | 14.5 | 10.9 | -13.5 | 10.4 | 21.4 | -11.7 | 3.7 | 12.9 | -13.4 | -8.5 | 12.9 |
| 05 to 33 | Transportable Goods Industries | 201.8 | 81.7 | 15.2 | 87.0 | -18.6 | 165.3 | 367.1 | 5.2 | -33.9 | 78.1 | 5.0 | 54.3 | 421.3 |
| 35 | Electricity, gas, steam and air-conditioning supply | 9.6 | 0.0 | 0.0 | 0.0 | 1.2 | 1.2 | 10.8 | 0.0 | -0.6 | 0.7 | -0.3 | -0.2 | 10.6 |
| 36 to 39 | Water supply, sewerage and waste management | 1.0 | 0.6 | 0.3 | 0.5 | 1.6 | 3.0 | 4.0 | 0.6 | 0.7 | 0.4 | 0.1 | 1.8 | 5.8 |
| 05 to 39 | Industries | 212.4 | 82.3 | 15.5 | 87.5 | -15.9 | 169.4 | 381.8 | 5.7 | -33.8 | 79.2 | 4.8 | 56.0 | 437.8 |
| 1 Preliminary estimates | ||||||||||||||
This release details quarterly changes in stocks of goods held in the Mining, Manufacturing, Energy and Waste Management sectors. The series are derived from a quarterly accounts inquiry to industrial enterprises with 20 or more persons engaged. This inquiry was initiated to meet national and EU requirements for quarterly economic variables, and is conducted under the Statistics (Business Accounts Surveys) Order, 2010, Number 349, made under the Statistics Act 1993.
The survey results, which cover all companies with 20+ employees, are grossed using the latest available Census of Industrial Production (CIP) data to represent levels of stocks for all industrial enterprises with 3+ persons engaged, and are shown at current values (seasonally unadjusted).
The series are short-term indicators of trends, and are subject to revision when the annual Census of Industrial Production results become available. The Census of Industrial Production covers all enterprises which are wholly or primarily engaged in industrial production and have three or more persons engaged.
The survey of approximately 2,000 enterprises covers all enterprises with 20+ persons engaged in the Mining, Manufacturing, Energy and Waste Management sectors.
Estimates are made for non-responding enterprises, and for those enterprises where the total stock level returned is zero. The opening stock level for each such enterprise in the current quarter is made equal to the closing stock level for that enterprise in the previous quarter. To estimate the closing stock level for the enterprise in the current quarter, the sample is classified into relatively homogeneous cells defined by NACE division and employment size, and the cell ratio closing stocks to opening stocks (calculated from the aggregated respondent values in the non-respondent’s cell) is applied to the opening stock level for the enterprise. The stock change is derived as the closing stock level minus the opening stock level.
To derive estimates inclusive of those enterprises having 3 to 19 persons engaged, the sample results are grossed, by NACE division, using grossing ratios from the latest available CIP.
Stocks are valued (excluding VAT) on the accounting basis used by the enterprise. The stocks covered relate to goods actually held by the enterprise on its premises. Stock changes are calculated by subtracting the value of stocks at the beginning of the quarter from the value at the end of the quarter.
An enterprise is defined as the smallest combination of legal units that is an organisational unit producing goods or services, which benefits from a certain degree of autonomy in decision making, especially for the allocation of its current resources (e.g. company, partnership, individual proprietorship, etc.) An enterprise may be a sole legal unit.
The figures provided in this release are short-term indicators only. They are based on quarterly information supplied by enterprises, many of whom do not maintain sub-annual accounting systems. The annual Census of Industrial Production, which utilises financial accounts data, should be considered as the definitive reference for annual stocks information.
NACE division 15 has now been combined with divisions 12, 19 and 31 for confidentiality reasons.
 Hide Background Notes
Scan the QR code below to view this release online or go to
http://www.cso.ie/en/releasesandpublications/er/is/industrialstocksquarter42012/
 Show Table 1 Change in value of total stocks held in industry (€ million)
 Hide Table 1 Change in value of total stocks held in industry (€ million)