| Total Cereals | Cattle | Sheep | |
| '000 hectares | |||
| '000 | '000 | ||
| June 2012 | 315.4 | 6,754.1 | 5,170.0 |
| June 2013 | 307.8 | 6,902.6 | 5,110.6 |
| % change | -2.4 | +2.2 | -1.1 |
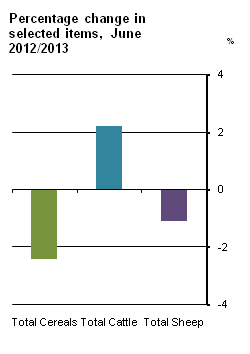
The final results for June 2013 show that the area under cereals decreased by 7,600 hectares (-2.4%) to 307,800 ha. The area under winter cereals (wheat, oats and barley) decreased by 48,700 ha (-36.0%), including a drop of 39,200 ha (-46.3%) in winter wheat. The area under spring cereals showed an increase of 40,900 ha (+22.9%) in the same period, with an increase of 31,700 ha (+20.9%) in spring barley. See Table 1.
The results also indicate that the total number of cattle was 6,902,600, an increase of 148,500 (+2.2%) on June 2012. This was mainly due to increases of 102,500 (+13.3%) in male cattle 1 to 2 years, 27,600 (+7.6%) in male cattle 2 years and over and an increase of 48,500 (+5.4%) in female cattle 1 to 2 years. The number of dairy cows also increased by 22,400 (+2.0%). See Table 2.
A comparison with the June 2012 results indicates that:
A regional analysis of the livestock numbers indicates that the largest number of cattle (1,376,800) was in the South-West region, the largest number of sheep (1,355,800) was in the West region and the largest number of pigs (417,100) was in the Border region. See Tables 4 and 5.
| X-axis label | Sheep | Cattle |
|---|---|---|
| Border | 1097.7 | 893.7 |
| Mid-East & Dublin | 798.8 | 580.5 |
| Midland | 313.1 | 801 |
| Mid-West | 127.1 | 1009.1 |
| South-East | 702.2 | 1313.2 |
| South-West | 715.8 | 1376.8 |
| West | 1355.8 | 928.4 |
| X-axis label | Selected crops |
|---|---|
| Winter wheat | -39.2 |
| Spring wheat | 1.7 |
| Winter oats | -4.5 |
| Spring oats | 7.5 |
| Winter barley | -5 |
| Spring barley | 31.7 |
| Potatoes | 1.7 |
| Table 1 Area under Crops and Pasture | |||||
| Description | June 2011 | June 2012 | June 2013 | Change 2012 - 2013 | |
| ' 000 hectares | ' 000 hectares | % | |||
| Wheat - total | 94.2 | 98.0 | 60.6 | -37.4 | -38.2 |
| Winter wheat | 77.7 | 84.6 | 45.4 | -39.2 | -46.3 |
| Spring wheat | 16.4 | 13.5 | 15.2 | 1.7 | 12.9 |
| Oats - total | 21.4 | 23.7 | 26.7 | 3.0 | 12.6 |
| Winter oats | 9.0 | 9.9 | 5.4 | -4.5 | -45.7 |
| Spring oats | 12.4 | 13.8 | 21.3 | 7.5 | 54.2 |
| Barley - total | 180.6 | 192.8 | 219.4 | 26.7 | 13.8 |
| Winter barley | 35.9 | 41.0 | 36.0 | -5.0 | -12.3 |
| Spring barley | 144.8 | 151.8 | 183.5 | 31.7 | 20.9 |
| Other cereals | 1.2 | 0.9 | 1.1 | 0.2 | 25.4 |
| Total cereals | 297.4 | 315.4 | 307.8 | -7.6 | -2.4 |
| Beans and peas | 2.9 | 4.1 | 4.5 | 0.4 | 9.4 |
| Oilseed rape | 12.4 | 17.5 | 13.7 | -3.8 | -21.7 |
| Arable silage | 2.9 | 2.4 | 3.9 | 1.6 | 66.3 |
| Maize silage | 19.0 | 13.7 | 14.5 | 0.8 | 5.8 |
| Fodder rape and kale | 1.3 | 1.7 | 1.4 | -0.2 | -14.9 |
| Potatoes | 10.4 | 9.0 | 10.7 | 1.7 | 19.4 |
| Turnips | 1.0 | 1.1 | 0.9 | -0.2 | -18.5 |
| Beet 1 | 8.2 | 7.8 | 10.1 | 2.3 | 29.4 |
| Vegetables for sale | 3.8 | 3.6 | 3.5 | -0.1 | -3.4 |
| Fruit | 0.8 | 0.9 | 0.9 | 0.0 | 4.8 |
| Nurseries, horticulture etc. | 0.4 | 0.4 | 0.5 | 0.0 | 11.8 |
| Other crops 2 | 4.9 | 4.5 | 4.7 | 0.2 | 3.7 |
| Total crops, fruit and horticulture | 365.4 | 382.1 | 377.2 | -4.9 | -1.3 |
| Silage | 1,070.2 | 1,075.0 | 1,071.0 | -3.9 | -0.4 |
| Hay | 213.2 | 203.5 | 218.4 | 14.9 | 7.3 |
| Pasture | 2,459.3 | 2,391.0 | 2,337.7 | -53.3 | -2.2 |
| Crops and Pasture | 4,108.2 | 4,051.5 | 4,004.3 | -47.2 | -1.2 |
| Rough grazing in use | 447.3 | 481.2 | 473.5 | -7.7 | -1.6 |
| Area farmed | 4,555.5 | 4,532.7 | 4,477.8 | -54.9 | -1.2 |
| 1 Includes sugar beet and fodder beet. | |||||
| 2 Includes fallow land, miscanthus,other energy crops and kitchen gardens. | |||||
| Table 2 Number of Livestock | |||||
| Description | June 2011 | June 2012 | June 2013 | Change 2012 - 2013 | |
| ' 000 | ' 000 | % | |||
| Total cattle | 6,493.0 | 6,754.1 | 6,902.6 | 148.5 | 2.2 |
| Dairy cows 1 | 1,116.9 | 1,140.8 | 1,163.2 | 22.4 | 2.0 |
| Other cows | 1,123.3 | 1,148.6 | 1,150.3 | 1.7 | 0.1 |
| Bulls 2 | 41.8 | 36.1 | 41.4 | 5.4 | 14.9 |
| Cattle male: 2 years and over | 425.5 | 360.6 | 388.2 | 27.6 | 7.6 |
| Cattle female: 2 years and over | 411.9 | 372.0 | 380.1 | 8.1 | 2.2 |
| Cattle male: 1-2 years | 673.4 | 770.2 | 872.7 | 102.5 | 13.3 |
| Cattle female: 1-2 years | 854.7 | 889.8 | 938.3 | 48.5 | 5.4 |
| Cattle male: under 1 year | 891.9 | 1,023.2 | 959.2 | -63.9 | -6.2 |
| Cattle female: under 1 year | 953.6 | 1,012.8 | 1,009.3 | -3.6 | -0.4 |
| Total cattle male | 2,032.7 | 2,190.1 | 2,261.5 | 71.4 | 3.3 |
| Total cattle female | 4,460.3 | 4,564.1 | 4,641.1 | 77.1 | 1.7 |
| Total sheep | 4,830.0 | 5,170.0 | 5,110.6 | -59.4 | -1.1 |
| Breeding sheep | 2,508.9 | 2,667.0 | 2,648.6 | -18.4 | -0.7 |
| Ewes: 2 years and over | 1,939.1 | 2,027.9 | 2,028.7 | 0.8 | 0.0 |
| Ewes: under 2 years | 496.1 | 561.4 | 539.5 | -21.9 | -3.9 |
| Rams | 73.7 | 77.7 | 80.4 | 2.7 | 3.4 |
| Other sheep | 2,321.0 | 2,503.0 | 2,462.0 | -41.1 | -1.6 |
| Total pigs | 1,549.0 | 1,570.6 | 1,552.0 | -18.6 | -1.2 |
| Breeding pigs | 156.2 | 145.7 | 147.5 | 1.8 | 1.2 |
| Female breeding pigs | 154.9 | 144.6 | 146.5 | 1.9 | 1.3 |
| Boars | 1.3 | 1.1 | 0.9 | -0.1 | -10.2 |
| Other pigs | 1,392.8 | 1,425.0 | 1,404.6 | -20.4 | -1.4 |
| 20kg and over | 972.0 | 980.7 | 955.8 | -24.9 | -2.5 |
| Less than 20kg | 420.8 | 444.3 | 448.8 | 4.5 | 1.0 |
| Horses and ponies | 106.0 | 111.1 | 101.6 | -9.5 | -8.6 |
| Mules, jennets and asses | 8.7 | 9.8 | 8.2 | -1.6 | -16.7 |
| Goats | 11.4 | 10.3 | 8.7 | -1.6 | -15.8 |
| Farmed deer | 2.8 | 2.1 | 1.5 | -0.5 | -24.7 |
| 1 Dairy cows are those kept principally to produce milk for human consumption. | |||||
| 2 Bulls used for breeding purposes only. | |||||
| Table 3 Area under Crops and Pasture in each Region, June 2013 | ' 000 ha | ||||||||||
| Region | Border, Midland and Western | Southern and Eastern | State | ||||||||
| Border | Midland | West | Total | Mid-East & Dublin | Mid-West | South-East | South-West | Total | |||
| Wheat - total | 5.4 | 4.4 | 0.2 | 10.0 | 25.7 | 1.0 | 16.8 | 7.2 | 50.6 | 60.6 | |
| Winter wheat | 4.9 | 3.3 | 0.1 | 8.2 | 19.6 | 0.5 | 12.9 | 4.2 | 37.2 | 45.4 | |
| Spring wheat | 0.5 | 1.1 | 0.1 | 1.8 | 6.1 | 0.5 | 3.9 | 2.9 | 13.4 | 15.2 | |
| Oats - total | 2.4 | 1.8 | 0.9 | 5.2 | 8.1 | 0.4 | 9.8 | 3.1 | 21.4 | 26.7 | |
| Winter oats | 0.3 | 0.6 | 0.0 | 0.8 | 1.8 | 0.0 | 2.3 | 0.4 | 4.5 | 5.4 | |
| Spring oats | 2.2 | 1.3 | 0.9 | 4.4 | 6.3 | 0.4 | 7.5 | 2.6 | 16.9 | 21.3 | |
| Barley - total | 16.3 | 26.3 | 4.3 | 46.9 | 49.9 | 8.6 | 78.7 | 35.2 | 172.5 | 219.4 | |
| Winter barley | 4.6 | 2.9 | 0.1 | 7.5 | 8.6 | 0.9 | 10.5 | 8.5 | 28.4 | 36.0 | |
| Spring barley | 11.7 | 23.4 | 4.3 | 39.4 | 41.3 | 7.8 | 68.2 | 26.8 | 144.1 | 183.5 | |
| Other cereals | 0.2 | 0.2 | 0.1 | 0.5 | 0.3 | 0.0 | 0.3 | 0.1 | 0.6 | 1.1 | |
| Total cereals | 24.3 | 32.7 | 5.5 | 62.6 | 84.0 | 10.0 | 105.6 | 45.5 | 245.2 | 307.8 | |
| Beans and peas | 0.3 | 0.4 | 0.1 | 0.8 | 1.6 | 0.0 | 1.3 | 0.8 | 3.7 | 4.5 | |
| Oilseed rape | 1.2 | 0.9 | 0.0 | 2.1 | 5.1 | 0.1 | 5.6 | 0.8 | 11.5 | 13.7 | |
| Arable silage | 0.7 | 0.6 | 0.3 | 1.6 | 0.6 | 0.1 | 0.7 | 0.9 | 2.4 | 3.9 | |
| Maize silage | 1.2 | 1.0 | 0.2 | 2.4 | 3.2 | 0.5 | 4.0 | 4.5 | 12.1 | 14.5 | |
| Fodder rape and kale | 0.1 | 0.3 | 0.2 | 0.5 | 0.2 | 0.1 | 0.4 | 0.3 | 0.9 | 1.4 | |
| Potatoes | 2.3 | 0.3 | 0.1 | 2.8 | 4.7 | 0.2 | 2.1 | 1.0 | 8.0 | 10.7 | |
| Turnips | 0.0 | 0.1 | 0.1 | 0.3 | 0.1 | 0.0 | 0.3 | 0.2 | 0.6 | 0.9 | |
| Beet 1 | 0.3 | 1.4 | 0.2 | 1.9 | 1.2 | 0.3 | 3.6 | 3.2 | 8.3 | 10.1 | |
| Vegetables for sale | 0.3 | 0.2 | 0.1 | 0.6 | 2.0 | 0.0 | 0.6 | 0.3 | 2.9 | 3.5 | |
| Fruit | 0.0 | 0.0 | 0.0 | 0.1 | 0.3 | 0.0 | 0.4 | 0.1 | 0.8 | 0.9 | |
| Nurseries, horticulture etc. | 0.0 | 0.0 | 0.0 | 0.0 | 0.0 | 0.0 | 0.3 | 0.1 | 0.4 | 0.5 | |
| Other crops 2 | 0.4 | 0.4 | 0.1 | 0.9 | 1.5 | 0.5 | 1.3 | 0.5 | 3.8 | 4.7 | |
| Crops, fruit and horticulture | 31.1 | 38.5 | 6.9 | 76.5 | 104.5 | 12.1 | 126.2 | 57.9 | 300.7 | 377.2 | |
| Silage | 174.7 | 114.9 | 176.8 | 466.3 | 84.8 | 153.9 | 168.9 | 197.0 | 604.7 | 1,071.0 | |
| Hay | 36.9 | 23.9 | 35.8 | 96.5 | 23.7 | 27.0 | 41.0 | 30.1 | 121.8 | 218.4 | |
| Pasture | 408.7 | 232.0 | 460.3 | 1,101.0 | 203.5 | 316.7 | 326.4 | 390.1 | 1,236.7 | 2,337.7 | |
| Crops and pasture | 651.4 | 409.2 | 679.8 | 1,740.4 | 416.5 | 509.7 | 662.5 | 675.2 | 2,263.9 | 4,004.3 | |
| Rough grazing in use | 123.5 | 18.1 | 107.5 | 249.1 | 26.6 | 36.3 | 34.9 | 126.6 | 224.4 | 473.5 | |
| Area farmed | 774.9 | 427.4 | 787.3 | 1,989.5 | 443.1 | 546.1 | 697.3 | 801.8 | 2,488.3 | 4,477.8 | |
| 1 Includes sugar beet and fodder beet. | |||||||||||
| 2 Includes fallow land, miscanthus,other energy crops and kitchen gardens. | |||||||||||
| Table 4 Number of Cattle in each Region and County, June 2013 | ' 000 | |||||||||||
| Region and County | Total | Dairy | Other | Bulls 2 | Cattle | Cattle | Cattle | Cattle | Cattle | Cattle | Total Cattle | Total Cattle |
| Cattle | Cows 1 | Cows | Male 2+ | Female 2+ | Male 1-2 | Female 1-2 | Male <1 | Female < 1 | Male | Female | ||
| State | 6,902.6 | 1,163.2 | 1,150.3 | 41.4 | 388.2 | 380.1 | 872.7 | 938.3 | 959.2 | 1,009.3 | 2,261.5 | 4,641.1 |
| Border, Midland and Western | 2,623.0 | 234.0 | 600.5 | 17.6 | 150.0 | 170.9 | 330.4 | 361.4 | 375.5 | 382.7 | 873.6 | 1,749.5 |
| Border | 893.7 | 103.3 | 202.7 | 6.2 | 36.1 | 53.9 | 105.7 | 120.8 | 128.8 | 136.1 | 276.9 | 616.8 |
| Cavan | 225.2 | 32.2 | 49.1 | 1.7 | 7.9 | 12.8 | 22.5 | 31.5 | 31.7 | 35.8 | 63.8 | 161.3 |
| Donegal | 191.1 | 16.9 | 45.7 | 1.2 | 6.0 | 10.5 | 27.9 | 24.5 | 30.2 | 28.4 | 65.2 | 125.9 |
| Leitrim | 66.6 | 1.9 | 25.8 | 0.7 | 1.1 | 3.9 | 3.6 | 6.9 | 11.1 | 11.7 | 16.5 | 50.2 |
| Louth | 84.6 | 13.1 | 13.1 | 0.4 | 6.4 | 5.8 | 11.7 | 12.4 | 10.2 | 11.5 | 28.7 | 55.9 |
| Monaghan | 209.2 | 31.4 | 35.8 | 1.4 | 9.8 | 12.9 | 29.0 | 30.7 | 27.7 | 30.5 | 67.9 | 141.3 |
| Sligo | 117.0 | 7.8 | 33.3 | 0.8 | 5.1 | 8.1 | 11.0 | 14.8 | 17.8 | 18.2 | 34.8 | 82.2 |
| Midland | 801.0 | 81.4 | 146.1 | 4.5 | 58.3 | 55.2 | 118.7 | 116.2 | 111.9 | 108.6 | 293.5 | 507.5 |
| Laois | 237.5 | 30.8 | 37.3 | 1.2 | 16.9 | 13.3 | 39.0 | 31.2 | 35.8 | 32.0 | 92.9 | 144.6 |
| Longford | 115.5 | 8.4 | 28.4 | 1.0 | 8.0 | 7.1 | 16.0 | 14.9 | 16.0 | 15.8 | 40.9 | 74.6 |
| Offaly | 228.8 | 21.9 | 35.7 | 1.1 | 17.0 | 17.9 | 36.5 | 36.4 | 31.7 | 30.6 | 86.2 | 142.6 |
| Westmeath | 219.2 | 20.4 | 44.6 | 1.3 | 16.3 | 16.9 | 27.3 | 33.7 | 28.5 | 30.2 | 73.4 | 145.8 |
| West | 928.4 | 49.3 | 251.7 | 6.9 | 55.5 | 61.9 | 106.0 | 124.3 | 134.8 | 138.0 | 303.2 | 625.2 |
| Galway | 432.0 | 27.7 | 109.6 | 3.2 | 28.0 | 28.7 | 50.0 | 58.4 | 62.0 | 64.4 | 143.2 | 288.8 |
| Mayo | 284.7 | 16.2 | 82.4 | 2.0 | 14.1 | 18.1 | 28.8 | 37.2 | 42.2 | 43.6 | 87.1 | 197.5 |
| Roscommon | 211.7 | 5.4 | 59.7 | 1.7 | 13.4 | 15.0 | 27.2 | 28.7 | 30.7 | 30.0 | 72.9 | 138.8 |
| Southern and Eastern | 4,279.6 | 929.2 | 549.8 | 23.8 | 238.2 | 209.2 | 542.3 | 576.9 | 583.7 | 626.6 | 1,388.0 | 2,891.6 |
| Mid-East and Dublin | 580.5 | 79.7 | 92.8 | 3.1 | 45.5 | 44.7 | 80.3 | 85.2 | 73.2 | 75.9 | 202.1 | 378.3 |
| Dublin | 24.5 | 2.7 | 4.3 | 0.1 | 1.7 | 2.3 | 3.2 | 4.4 | 2.9 | 2.9 | 7.9 | 16.6 |
| Kildare | 131.9 | 12.4 | 21.2 | 0.6 | 14.9 | 9.4 | 21.1 | 19.4 | 17.1 | 15.8 | 53.7 | 78.2 |
| Meath | 302.1 | 46.8 | 43.2 | 1.5 | 24.0 | 25.1 | 43.0 | 44.7 | 35.5 | 38.2 | 104.0 | 198.1 |
| Wicklow | 122.1 | 17.8 | 24.1 | 0.9 | 5.0 | 7.9 | 13.1 | 16.7 | 17.6 | 19.0 | 36.6 | 85.5 |
| Mid-West | 1,009.1 | 184.4 | 159.2 | 6.3 | 61.9 | 49.2 | 128.4 | 127.3 | 144.9 | 147.5 | 341.5 | 667.6 |
| Clare | 290.5 | 28.1 | 77.8 | 2.5 | 14.0 | 13.8 | 30.8 | 32.2 | 44.9 | 46.5 | 92.2 | 198.3 |
| Limerick | 406.9 | 101.9 | 43.2 | 2.3 | 25.3 | 19.4 | 50.3 | 52.9 | 53.3 | 58.3 | 131.2 | 275.7 |
| North Tipperary | 311.7 | 54.5 | 38.3 | 1.5 | 22.7 | 15.9 | 47.3 | 42.2 | 46.6 | 42.7 | 118.2 | 193.6 |
| South-East | 1,313.2 | 269.9 | 158.9 | 6.4 | 77.1 | 58.4 | 184.8 | 177.6 | 192.1 | 187.9 | 460.5 | 852.7 |
| Carlow | 98.2 | 11.4 | 18.0 | 0.6 | 4.7 | 5.4 | 13.6 | 14.0 | 16.5 | 14.1 | 35.3 | 62.8 |
| Kilkenny | 349.5 | 65.9 | 41.5 | 1.6 | 22.4 | 14.2 | 54.8 | 46.1 | 53.7 | 49.3 | 132.5 | 217.0 |
| South Tipperary | 333.0 | 74.8 | 33.7 | 1.4 | 25.4 | 13.9 | 47.0 | 42.6 | 48.0 | 46.2 | 121.8 | 211.2 |
| Waterford | 255.1 | 63.3 | 27.9 | 1.3 | 14.4 | 10.6 | 31.2 | 34.8 | 33.4 | 38.3 | 80.2 | 174.9 |
| Wexford | 277.3 | 54.4 | 37.7 | 1.5 | 10.3 | 14.3 | 38.3 | 40.1 | 40.6 | 40.1 | 90.6 | 186.7 |
| South-West | 1,376.8 | 395.2 | 138.9 | 8.0 | 53.6 | 57.0 | 148.7 | 186.8 | 173.5 | 215.3 | 383.8 | 993.0 |
| Cork | 1,040.9 | 306.4 | 89.6 | 5.4 | 42.8 | 42.1 | 120.9 | 143.1 | 130.8 | 160.0 | 299.9 | 741.0 |
| Kerry | 335.9 | 88.8 | 49.3 | 2.5 | 10.9 | 14.9 | 27.8 | 43.6 | 42.8 | 55.3 | 84.0 | 252.0 |
| 1 Dairy cows are those kept principally to produce milk for human consumption. | ||||||||||||
| 2 Bulls used for breeding purposes only. | ||||||||||||
| Table 5 Number of Sheep, Pigs and Other Livestock in each Region, June 2013 | ' 000 | ||||||||||
| Region | Border, Midland and Western | Southern and Eastern | State | ||||||||
| Border | Midland | West | Total | Mid-East & Dublin | Mid-West | South-East | South-West | Total | |||
| Total sheep | 1,097.7 | 313.1 | 1,355.8 | 2,766.6 | 798.8 | 127.1 | 702.2 | 715.8 | 2,344.0 | 5,110.6 | |
| Breeding sheep | 579.5 | 158.9 | 697.4 | 1,435.7 | 412.2 | 68.4 | 359.7 | 372.6 | 1,212.9 | 2,648.6 | |
| Ewes: 2 years and over | 452.3 | 125.2 | 529.0 | 1,106.5 | 313.2 | 47.2 | 271.5 | 290.4 | 922.3 | 2,028.7 | |
| Ewes: under 2 years | 109.6 | 28.8 | 145.3 | 283.7 | 88.1 | 18.5 | 78.2 | 71.1 | 255.8 | 539.5 | |
| Rams | 17.6 | 4.8 | 23.1 | 45.6 | 10.9 | 2.7 | 10.0 | 11.1 | 34.8 | 80.4 | |
| Other sheep | 518.2 | 154.2 | 658.4 | 1,330.9 | 386.6 | 58.7 | 342.5 | 343.3 | 1,131.1 | 2,462.0 | |
| Total pigs | 417.1 | 273.2 | 43.8 | 734.1 | 82.6 | 93.2 | 312.0 | 330.0 | 817.9 | 1,552.0 | |
| Breeding pigs | 39.6 | 24.5 | 3.8 | 67.9 | 9.4 | 10.2 | 28.0 | 32.0 | 79.6 | 147.5 | |
| Female breeding pigs | 39.4 | 24.3 | 3.7 | 67.5 | 9.4 | 10.2 | 27.8 | 31.8 | 79.0 | 146.5 | |
| Boars | 0.2 | 0.2 | 0.0 | 0.4 | 0.0 | 0.1 | 0.2 | 0.2 | 0.5 | 0.9 | |
| Other pigs | 377.4 | 248.8 | 40.1 | 666.3 | 73.2 | 83.0 | 284.1 | 298.1 | 738.3 | 1,404.6 | |
| 20kg and over | 255.7 | 180.7 | 26.7 | 463.0 | 44.2 | 57.9 | 196.8 | 194.0 | 492.8 | 955.8 | |
| Less than 20kg | 121.8 | 68.1 | 13.4 | 203.3 | 29.0 | 25.1 | 87.3 | 104.1 | 245.5 | 448.8 | |
| Horses and ponies | 11.7 | 9.6 | 19.6 | 40.8 | 15.8 | 11.6 | 20.4 | 12.9 | 60.7 | 101.6 | |
| Mules, jennets and asses | 1.6 | 0.4 | 2.8 | 4.8 | 0.6 | 1.4 | 0.6 | 0.8 | 3.4 | 8.2 | |
| Goats | 1.0 | 0.7 | 1.1 | 2.9 | 1.8 | 1.4 | 0.7 | 1.9 | 5.8 | 8.7 | |
| Farmed deer | 0.2 | 0.0 | 0.7 | 0.9 | 0.1 | 0.0 | 0.3 | 0.2 | 0.6 | 1.5 | |
Introduction
This release presents final estimates of land utilisation and livestock numbers in June 2013 at State and regional level. The estimates for sheep and pigs are based on returns from the 2013 June sample survey of agricultural holdings and the June 2013 Pig Survey conducted by the Central Statistics Office (CSO). The estimates for cattle and for crops are obtained from administrative data from the Department of Agriculture, Food and the Marine (DAFM).
Coverage Farms where the agricultural area used was at least one hectare (2.47 acres) are included in the June Agricultural Sample Survey. Farms with less than one hectare may also be included if they were engaged in intensive production.
Results
Crops The results for crops are based on data obtained from the DAFM Single Payment Scheme.
Cattle The results for cattle are obtained from DAFM’s Animal Identification and Movement (AIM) system, formerly known as the Cattle Movement Monitoring System (CMMS). This system was introduced at the beginning of 2000 and involves electronically recording data on animal movements.
Sheep The June 2013 results for sheep are based on the trends obtained by comparing the returns from the 2013 sample with the 2012 returns for the same 5,900 farms and applying these trends to the June 2012 figures.
Pigs A specialist pig survey was conducted by the CSO due to the intensive nature of this activity.
As the figures in the text and tables have been rounded to the nearest 100 units, there may be slight discrepancies between the sum (or difference) of the constituent items and the total shown. Percentage changes have been calculated on actual figures.
_____________________________________________________________________________
Composition of Regions
Border, Midland and Western NUTS 2 Region
Border Cavan, Donegal, Leitrim, Louth, Monaghan and Sligo
Midland Laois, Longford, Offaly and Westmeath
West Galway City, Galway County, Mayo and Roscommon
Southern and Eastern NUTS 2 Region
Dublin Dublin City, Dun Laoghaire-Rathdown, Fingal and South Dublin
Mid-East Kildare, Meath and Wicklow
Mid-West Limerick City, Limerick County, Clare and North Tipperary
South-East Waterford City, Waterford County, Carlow, Kilkenny, Wexford
and South Tipperary
South-West Cork City, Cork County and Kerry
 Hide Background Notes
Scan the QR code below to view this release online or go to
http://www.cso.ie/en/releasesandpublications/er/clsjf/cropsandlivestocksurveyjunefinal2013/
 Show Table 1 Area under Crops and Pasture
 Hide Table 1 Area under Crops and Pasture