
| Building and Construction Inquiry (BCI) 2008-2011 | ||||||||||||
| Percentage change | ||||||||||||
| 2008 | 20091 | 20101 | 2011 | 2008-2011 | 2010-2011 | |||||||
| Production value (€ million) | 31,739 | 15,527 | 8,553 | 8,501 | -73.2 | -0.6 | ||||||
| Intermediate consumption (€ million) | 21,116 | 9,596 | 5,045 | 4,642 | -78.0 | -8.0 | ||||||
| Gross Value Added (€ million) | 10,623 | 5,931 | 3,508 | 3,859 | -63.7 | 10.0 | ||||||
| Number of enterprises | 47,518 | 38,014 | 32,288 | 28,080 | -40.9 | -13.0 | ||||||
| Persons engaged (number) | 151,906 | 93,321 | 91,824 | 90,109 | -40.7 | -1.9 | ||||||
| 1 BCI data for 2009 and 2010 were revised following initial publication | ||||||||||||
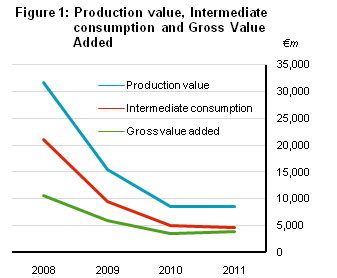
The construction sector showed signs of stabilising in 2011 following a continual decline since 2008. In 2011, production value fell by just 0.6% compared to a fall of 44.9% in 2010 and a fall of 51.1% in 2009. Since 2008, production value has decreased by 73.2% from €31.7 billion to €8.5 billion in 2011.
Similarly, in 2011, intermediate consumption declined 8% compared to a fall of 47.4% in 2010 and a fall of 54.6% in 2009. Since 2008, intermediate consumption has decreased by 78% from €21.1 billion to €4.6 billion in 2011.
With purchases declining at a faster rate than turnover, in 2011, Gross Value Added rose by 10% compared to a fall of 40.9% in 2010 and a fall of 44.2% in 2009. Since 2008, Gross Value Added has decreased by 63.7% from €10.6 billion to €3.9 billion in 2011. See Figure 1.

Construction sector in Ireland 2008-2011
Since 2008, the construction sector has experienced a reduction of 40.9% in the number of enterprises, which is a drop of 19,500 enterprises from 47,500 enterprises in 2008 to just over 28,000 enterprises in 2011. Between 2010 and 2011, approximately 4,200 enterprises have ceased operations, falling from almost 32,300 in 2010 to just over 28,100 in 2011. This represents a decline of 13% in 2011.
Employment in construction enterprises has experienced a reduction of 40.7% in the same period. In 2008, almost 152,000 persons were engaged in construction, whereas by 2011, this number had dropped to just over 90,000 persons. Between 2010 and 2011, approximately 1,700 fewer persons have been engaged in the construction sector in Ireland, falling from just over 91,800 in 2010 to approximately 90,100 in 2011. This represents a decline of 1.9% in the past year. See Figure 2.

Turnover down 71% and Gross Value Added down 64% between 2008 and 2011
Turnover since 2008 has fallen 71.2% to €9.31 billion, however, between 2010 and 2011 turnover only declined by 1.4%.
Gross Value Added has fallen 63.7% since 2008, to approximately €3.86 billion in 2011. See Figure 3.
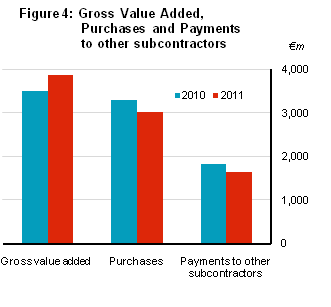
Purchases down 71% between 2008 and 2011 while Gross Value Added increased 10% between 2010 and 2011
Total purchases have been in continual decline since 2008, when the reported value was €10.6 billion. By 2011 this figure had dropped to just over €3 billion.
Gross Value Added increased by 10% or €352 million in 2011. The rise in Gross Value Added was largely driven by a fall in purchases of 8.2%, which equated to €271 million, and a fall of 9.7% or €177 million in payments to subcontractors. A reduction in the value of stocks at the end of 2011 also contributed to this increase. See Figure 4.
Turnover per person employed - EU comparisons
In 2008, Ireland had the highest turnover per person employed in the construction sector in the EU at over €305,000. The next closest country to Ireland was The Netherlands, with just over €195,000 worth of turnover per person employed.
By 2010, Ireland’s turnover per person employed had dropped to just under €180,000. Although this ranked second in the EU-27, the figure in 2010 was much more in line with the levels of other countries than was the case in 2008.
In 2011, Ireland’s turnover per person employed continued to decline and had fallen to approximately €147,000. Data for 2011 for the EU-27 is not yet available but is due to be published later in 2013. See Figure 5.

Revisions to BCI 2009 and 2010
This release provides revised data for the BCI 2009 and 2010 data. As a result of the revisions, in BCI 2009, production value fell from €16.4 billion to €15.5 billion, intermediate consumption rose from €9.2 billion to €9.6 billion and Gross Value Added fell from €7.2 billion to €5.9 billion. In BCI 2010, production value fell from €8.7 billion to €8.5 billion, intermediate consumption fell from €5.2 billion to €5.0 billion and Gross Value Added rose from €3.4 billion to €3.5 billion.
Please use the following links to access Building and Construction data:
Statbank link - Click here
Eurostat link - Click here
Background Notes to Building & Construction Inquiry Methodology
Scope and Coverage
The Building and Construction Inquiry (BCI) introduced in 2009 for reference year 2008 onwards, replaces the Census of Building and Construction (CBC). The CBC was intended to cover firms in the private (i.e non-State) sector with 20 or more persons engaged whose main activity is building, construction or civil engineering i.e firms classified to Section F of NACE Rev.2 of the NACE Industrial Classification of Economic Activity in the European Communities (NACE Rev. 2). In addition to covering private firms with 10 or more persons engaged, the BCI also covers a sample of private firms with less than 10 persons engaged.
Introduction of NACE Rev. 2
The NACE Industrial Classification of Economic Activities developed in the European Community has been revised. All Firms classified according to NACE Rev. 2. Prior to 2008, CBC results were classified according to NACE Rev. 1.1. For further information on the NACE Rev. 2 classification of industrial activity visit the CSO website: Classification of Industrial Activity.
History
The Census of Building and Construction first appeared as a separate census in 1966. Prior to that, data on the building and construction sector was collected and published in the Irish Statistical Bulletin/ Irish Trade Journal as part of the Census of Industrial Production (first inclusion in the 1926 Census). It was first published as a separate release document in 1981. Data since 1981 is available electronically on our website www.cso.ie via CSO Statistical Databases/Statbank.
Section F of NACE Rev. 2 - All building and construction comprising: NACE Activity Classifications
Nace 41.1 Development of building projects
Nace 41.2 Construction of residential and non-residential buildings
Nace 42.1 Construction of roads and railways
Nace 42.2 Construction of utility projects
Nace 42.9 Construction of other civil engineering projects
Nace 43.1 Demolition and site preparation
Nace 43.2 Electrical, plumbing and other construction installation activities
Nace 43.3 Building completion and finishing
Nace 43.9 Other specialised construction activities
Definition of Variables
Employees are persons who are paid a fixed wage or salary. Persons at work or temporarily absent because of illness, holidays, strike etc. are included. Persons working on a labour-only subcontract basis are excluded.
Manual Employees comprise skilled operatives, apprentices and unskilled operatives.
Other Employees comprise supervisory staff (foremen and supervisors), managerial, technical and clerical (male and female) employees.
Proprietors and family members, included here are those proprietors, partners etc. and members of their families who work regularly in the firm and are not paid a definite wage or salary.
Wages and salaries is the gross amount paid to employees before deduction of income tax, employees' social security contributions etc. plus payments to labour-only subcontractors. Overtime pay, bonuses, holiday pay and sick pay are included.
Acquisitions and sales of capital assets where Capital assets are defined as new and second-hand goods with an expected life of more than one year intended for use by the firm itself. Acquisitions include both purchases and construction by the firm itself of capital goods for its own use.
Production value represents the net selling value of work done during the year, whether sold or not. It is valued exclusive of VAT. It incorporates an element of double counting arising from the fact that work done on a subcontract basis by firms in a particular sector for other firms in the same sector is included in the turnover figures provided by both firms. However, in the calculation of Gross Value Added and variable 43 (value of work done by own staff) this double counting is eliminated.
Intermediate consumption represents the value of building materials, fuel, industrial services and other goods and services used in production. The definition of this variable has been changed from that given in the 1981 results (Statistical Bulletin, March 1985) to include payments to subcontractors as part of the cost of industrial services, thereby eliminating double counting from the Gross Value Added figures.
Gross Value Added is the difference between production value and intermediate consumption and represents the value added by the firm. Because work done by subcontractors is treated as part of intermediate consumption, there is no double counting in this variable.
 Hide Background Notes
Scan the QR code below to view this release online or go to
http://www.cso.ie/en/releasesandpublications/er/bci/buildingandconstructioninquiry2011/
 Show Background Notes
 Hide Background Notes