| Number of HSE funded optical treatments, 2013 - 2015 | |||
| '000s of treatments | |||
| Gender | 2013 | 2014 | 2015 |
| Male | 319.2 | 316.2 | 315.5 |
| Female | 451.6 | 449.3 | 453.9 |
| State Total | 770.8 | 765.4 | 769.4 |
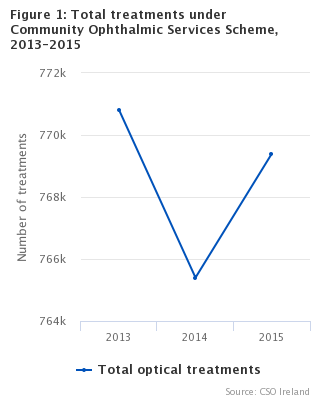
The number of Health Service Executive (HSE) funded treatments under the Community Ophthalmic Services Scheme (COSS) fell from 770.8 thousand in 2013 to 769.4 thousand in 2015. This is less than 1% of a reduction.
These payments were paid for by the Primary Care Reimbursement Service (PCRS). Please see background notes for a further description of the PCSR and COSS.
Summary Points
| Age related macular degeneration | Cataracts | Diabetic Ophthalmic Management | Glaucoma | |
| 2013 | 1500 | 3800 | 2500 | 4400 |
| 2014 | 1700 | 4000 | 2000 | 4600 |
| 2015 | 1600 | 3800 | 1500 | 4500 |
| 2013 | 2014 | 2015 | |
| 0 - 24 years | 31.78 | 31.79 | 31.83 |
| 25 - 34 years | 32.5 | 32.47 | 32.66 |
| 35 - 44 years | 34.32 | 34.26 | 34.42 |
| 45 - 54 years | 37.61 | 37.73 | 37.74 |
| 55 - 64 years | 39.45 | 39.4 | 39.39 |
| 65 - 74 years | 41.04 | 41.01 | 40.8 |
| 75 years and over | 40.91 | 40.89 | 40.61 |
| Table 1: Total number and percentage of optical treatments by treatment description, 2013-2015 | ||||||||
| 2013 | 2014 | 2015 | ||||||
| '000s | % | '000s | % | '000s | % | |||
| Treatment Description | ||||||||
| Appliances (incl. glasses and contact lenses) | 408.4 | 53.0 | 408.1 | 53.3 | 412.2 | 53.6 | ||
| Eye examination | 295.7 | 38.4 | 290.9 | 38.0 | 291.9 | 37.9 | ||
| Home visit by optician/ophthalmologist | 10.1 | 1.3 | 9.7 | 1.3 | 10.7 | 1.4 | ||
| Medical optical treatment | 25.4 | 3.3 | 27.4 | 3.6 | 26.4 | 3.4 | ||
| Repairs and replacements | 31.2 | 4.1 | 29.3 | 3.8 | 28.2 | 3.7 | ||
| Total treatments | 770.8 | 100.0 | 765.4 | 100.0 | 769.4 | 100.0 | ||
| Table 2: Number of optical treatments, by gender, age group and Local Health Office region, 2013-2015 | ||||||||
| 000s of treatments | ||||||||
| Appliances (incl. glasses and contact lenses) | Eye examination | Home visit by optician/ opthalmologist | Medical optical treatment | Repairs and replacements | Total treatments | |||
| State | ||||||||
| Total | 2013 | 407.4 | 295.6 | 10.1 | 25.4 | 31.2 | 770.8 | |
| 2014 | 408.1 | 290.9 | 9.7 | 27.4 | 29.3 | 765.5 | ||
| 2015 | 412.2 | 291.9 | 10.7 | 26.5 | 28.3 | 769.4 | ||
| Gender | ||||||||
| Male | 2013 | 171.9 | 121.6 | 3.5 | 10.1 | 12.0 | 319.2 | |
| 2014 | 171.5 | 119.6 | 3.4 | 10.6 | 11.1 | 316.2 | ||
| 2015 | 171.7 | 119.1 | 3.8 | 10.1 | 10.8 | 315.5 | ||
| Female | 2013 | 235.5 | 174.0 | 6.6 | 15.3 | 19.2 | 451.6 | |
| 2014 | 236.6 | 171.3 | 6.3 | 16.8 | 18.2 | 449.3 | ||
| 2015 | 240.5 | 172.8 | 6.9 | 16.4 | 17.5 | 453.9 | ||
| Age Group | ||||||||
| 0 - 24 years | 2013 | 27.1 | 25.9 | <0.1 | 0.3 | 1.4 | 54.8 | |
| 2014 | 28.6 | 26.6 | <0.1 | 0.3 | 1.3 | 56.9 | ||
| 2015 | 30.0 | 27.7 | <0.1 | 0.3 | 1.2 | 59.3 | ||
| 25 - 34 years | 2013 | 18.0 | 18.3 | <0.1 | 0.6 | 1.0 | 37.8 | |
| 2014 | 17.5 | 17.6 | <0.1 | 0.6 | 0.8 | 36.5 | ||
| 2015 | 17.1 | 17.0 | <0.1 | 0.6 | 0.7 | 35.5 | ||
| 35 - 44 years | 2013 | 28.6 | 26.0 | 0.1 | 0.9 | 1.4 | 57.0 | |
| 2014 | 28.6 | 25.5 | 0.1 | 0.9 | 1.2 | 56.4 | ||
| 2015 | 28.5 | 25.1 | 0.1 | 0.9 | 1.2 | 55.8 | ||
| 45 - 54 years | 2013 | 58.7 | 42.7 | 0.2 | 1.5 | 3.4 | 106.5 | |
| 2014 | 59.4 | 42.5 | 0.2 | 1.6 | 3.1 | 106.9 | ||
| 2015 | 59.6 | 42.3 | 0.2 | 1.5 | 2.9 | 106.4 | ||
| 55 - 64 years | 2013 | 67.5 | 45.4 | 0.4 | 2.5 | 4.5 | 120.2 | |
| 2014 | 68.0 | 45.0 | 0.4 | 2.6 | 4.2 | 120.2 | ||
| 2015 | 69.7 | 45.4 | 0.5 | 2.5 | 3.9 | 122.0 | ||
| 65 - 74 years | 2013 | 95.8 | 66.1 | 1.2 | 6.5 | 8.6 | 178.1 | |
| 2014 | 94.9 | 64.2 | 1.1 | 6.7 | 8.2 | 175.2 | ||
| 2015 | 95.8 | 64.7 | 1.2 | 6.2 | 7.9 | 175.8 | ||
| 75 years and over | 2013 | 112.8 | 71.3 | 8.2 | 13.1 | 10.9 | 216.3 | |
| 2014 | 111.0 | 69.4 | 8.0 | 14.7 | 10.3 | 213.3 | ||
| 2015 | 111.5 | 69.7 | 8.7 | 14.5 | 10.4 | 214.7 | ||
| Local Health Office Region | ||||||||
| Dublin Mid-Leinster | 2013 | 101.1 | 71.7 | 2.7 | 14.3 | 7.2 | 196.9 | |
| 2014 | 98.9 | 68.3 | 2.9 | 15.3 | 6.5 | 192.0 | ||
| 2015 | 100.7 | 68.7 | 3.4 | 14.5 | 6.0 | 193.3 | ||
| Dublin North East | 2013 | 78.1 | 51.4 | 2.3 | 4.5 | 5.0 | 141.4 | |
| 2014 | 79.6 | 51.6 | 2.2 | 5.4 | 5.0 | 143.8 | ||
| 2015 | 78.4 | 51.3 | 2.3 | 5.8 | 4.7 | 142.5 | ||
| South | 2013 | 119.5 | 89.0 | 2.8 | 4.1 | 9.5 | 224.8 | |
| 2014 | 118.1 | 86.8 | 2.3 | 3.7 | 8.8 | 219.7 | ||
| 2015 | 120.6 | 87.8 | 2.7 | 3.6 | 8.7 | 223.3 | ||
| West | 2013 | 109.7 | 83.6 | 2.3 | 2.5 | 9.6 | 207.7 | |
| 2014 | 111.5 | 84.1 | 2.3 | 2.9 | 9.1 | 209.9 | ||
| 2015 | 112.5 | 84.2 | 2.3 | 2.5 | 8.8 | 210.2 | ||
| Table 3: Average number of claims per person, by gender, age group, and local health office region, 2013-2015 | ||||||
| Number of claims | ||||||
| 2013 | 2014 | 2015 | ||||
| State | ||||||
| Total | 2.1 | 2.2 | 2.2 | |||
| Gender | ||||||
| Female | 2.1 | 2.1 | 2.2 | |||
| Male | 2.2 | 2.2 | 2.2 | |||
| Age Group | ||||||
| 0 - 24 years | 1.8 | 1.8 | 1.8 | |||
| 25 - 34 years | 1.8 | 1.8 | 1.8 | |||
| 35 - 44 years | 2.0 | 2.0 | 2.0 | |||
| 45 - 54 years | 2.2 | 2.2 | 2.2 | |||
| 55 - 64 years | 2.3 | 2.3 | 2.3 | |||
| 65 - 74 years | 2.2 | 2.2 | 2.3 | |||
| 75 years and over | 2.2 | 2.2 | 2.3 | |||
| Local Health Office Region | ||||||
| Dublin Mid-Leinster | 2.1 | 2.1 | 2.1 | |||
| Dublin North East | 2.2 | 2.2 | 2.2 | |||
| South | 2.2 | 2.2 | 2.2 | |||
| West | 2.2 | 2.2 | 2.2 | |||
| Table 4: Number of selected major optical conditions, by gender, age group and Local Health Office region, 2013-2015 | ||||||
| '000s of treatments | ||||||
| Age related macular degeneration | Cataracts | Diabetic Opthalmic Management | Glaucoma | |||
| State | ||||||
| Total | 2013 | 1.5 | 3.8 | 2.5 | 4.4 | |
| 2014 | 1.7 | 4.0 | 2.0 | 4.6 | ||
| 2015 | 1.6 | 3.8 | 1.5 | 4.5 | ||
| Gender | ||||||
| Male | 2013 | 0.5 | 1.4 | 1.4 | 2.0 | |
| 2014 | 0.6 | 1.4 | 1.0 | 2.1 | ||
| 2015 | 0.5 | 1.4 | 0.8 | 2.1 | ||
| Female | 2013 | 1.0 | 2.4 | 1.2 | 2.4 | |
| 2014 | 1.1 | 2.5 | 1.0 | 2.5 | ||
| 2015 | 1.1 | 2.4 | 0.7 | 2.5 | ||
| Age Group | ||||||
| 0 - 24 years | 2013 | <0.1 | <0.1 | <0.1 | <0.1 | |
| 2014 | <0.1 | <0.1 | <0.1 | <0.1 | ||
| 2015 | <0.1 | <0.1 | <0.1 | <0.1 | ||
| 25 - 34 years | 2013 | <0.1 | <0.1 | <0.1 | <0.1 | |
| 2014 | <0.1 | <0.1 | <0.1 | <0.1 | ||
| 2015 | <0.1 | <0.1 | <0.1 | <0.1 | ||
| 35 - 44 years | 2013 | <0.1 | <0.1 | 0.1 | 0.1 | |
| 2014 | <0.1 | <0.1 | 0.1 | 0.1 | ||
| 2015 | <0.1 | <0.1 | 0.1 | 0.1 | ||
| 45 - 54 years | 2013 | <0.1 | <0.1 | 0.3 | 0.3 | |
| 2014 | <0.1 | 0.1 | 0.2 | 0.3 | ||
| 2015 | <0.1 | 0.1 | 0.1 | 0.3 | ||
| 55 - 64 years | 2013 | 0.1 | 0.2 | 0.4 | 0.5 | |
| 2014 | 0.1 | 0.2 | 0.3 | 0.5 | ||
| 2015 | 0.1 | 0.2 | 0.3 | 0.6 | ||
| 65 - 74 years | 2013 | 0.4 | 1.1 | 0.8 | 1.4 | |
| 2014 | 0.4 | 1.1 | 0.6 | 1.4 | ||
| 2015 | 0.4 | 1.0 | 0.5 | 1.4 | ||
| 75 years and over | 2013 | 1.0 | 2.5 | 0.8 | 2.0 | |
| 2014 | 1.1 | 2.6 | 0.7 | 2.2 | ||
| 2015 | 1.0 | 2.4 | 0.5 | 2.1 | ||
| Local Health Office Region | ||||||
| Dublin Mid-Leinster | 2013 | 1.0 | 2.6 | 1.4 | 2.5 | |
| 2014 | 1.1 | 2.7 | 1.1 | 2.5 | ||
| 2015 | 1.0 | 2.5 | 0.8 | 2.4 | ||
| Dublin North East | 2013 | 0.3 | 0.5 | 0.3 | 0.9 | |
| 2014 | 0.3 | 0.6 | 0.2 | 1.1 | ||
| 2015 | 0.3 | 0.6 | 0.2 | 1.3 | ||
| South | 2013 | 0.2 | 0.5 | 0.4 | 0.7 | |
| 2014 | 0.1 | 0.4 | 0.4 | 0.7 | ||
| 2015 | 0.1 | 0.4 | 0.3 | 0.7 | ||
| West | 2013 | 0.1 | 0.3 | 0.3 | 0.3 | |
| 2014 | 0.1 | 0.3 | 0.3 | 0.3 | ||
| 2015 | 0.1 | 0.3 | 0.2 | 0.2 | ||
| Table 5: Average payment per optical treatment, by gender, age group, and local health office region, 2013-2015 | ||||||
| € | ||||||
| 2013 | 2014 | 2015 | ||||
| State | ||||||
| Total | 38.71 | 38.68 | 38.57 | |||
| Gender | ||||||
| Male | 38.68 | 38.64 | 38.53 | |||
| Female | 38.73 | 38.70 | 38.60 | |||
| Age Group | ||||||
| 0 - 24 years | 31.78 | 31.79 | 31.83 | |||
| 25 - 34 years | 32.50 | 32.47 | 32.66 | |||
| 35 - 44 years | 34.32 | 34.26 | 34.42 | |||
| 45 - 54 years | 37.61 | 37.73 | 37.74 | |||
| 55 - 64 years | 39.45 | 39.40 | 39.39 | |||
| 65 - 74 years | 41.04 | 41.01 | 40.80 | |||
| 75 years and over | 40.91 | 40.89 | 40.61 | |||
| Local Health Office Region | ||||||
| Dublin Mid-Leinster | 40.39 | 40.38 | 40.21 | |||
| Dublin North East | 38.78 | 38.90 | 38.89 | |||
| South | 38.01 | 37.90 | 37.84 | |||
| West | 37.82 | 37.78 | 37.63 | |||
The data in this release are provided to the Central Statistics Office by the Primary Care Reimbursement Service (PCRS). The PCRS is the part of the Health Service Executive (HSE) that processes payments to all of the GPs, pharmacists, opticians and other health professionals who provide free or reduced cost services to the public.
Payments to opticians and ophthalmologists are covered under the Community Ophthalmic Services Scheme (COSS). Under the COSS, General Medical Services (GMS) eligible adults have access to a range of treatments and clinical procedures. All claims under the COSS are processed and paid by the PCRS.
Under the GMS, people who are unable without undue hardship to arrange general practitioner medical and surgical services for themselves and their dependants may be granted a medical card and receive free general medical services.
The figures derived in this release refer to treatments that were carried out in the corresponding year.
Treatments and definitions
Regions
The regions consist of the local health offices and are constructed as follows;
| Local Health Offices | |||
|
Dublin Mid-Leinster |
Dublin South |
Dublin North East |
Dublin North West |
| Dublin South East | Dublin North Central | ||
| Dublin South City | Dublin North City | ||
| Dublin South West | Cavan / Monaghan | ||
| Dublin West | Louth | ||
| Kildare / West Wicklow | Meath | ||
| Wicklow | |||
| Laois / Offaly | |||
| Longford / Westmeath | |||
|
West |
Galway |
South |
South Lee Cork |
| Mayo | North Lee Cork | ||
| Roscommon | West Cork | ||
| Donegal | Kerry | ||
| Sligo / Leitrim | North Cork | ||
| Clare | Carlow / Kilkenny | ||
| North Tipperary / East Limerick | Waterford | ||
| Limerick | South Tipperary | ||
| Wexford | |||
 Hide Background Notes
Scan the QR code below to view this release online or go to
http://www.cso.ie/en/releasesandpublications/er/hfot/hsefundedopticaltreatments2013-2015/
 Show Table 1: Total number and percentage of optical treatments by treatment description, 2013-2015
 Hide Table 1: Total number and percentage of optical treatments by treatment description, 2013-2015