| Goods Output | Intermediate Consumption | Net Subsidies | Operating Surplus | |
| 2012 | €6,542m | €5,054m | €1,654m | €2,295m |
| 2013 | €7,390m | €5,697m | €1,517m | €2,390m |
| 2014 | €7,000m | €5,135m | €1,489m | €2,499m |
| % Change ('13 on '12) | 13.0% | 12.7% | -8.3% | 4.1% |
| % Change ('14 on '13) | -5.3% | -9.9% | -1.8% | 4.6% |
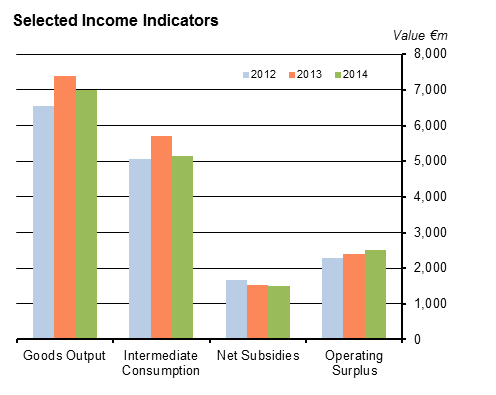
The CSO's final estimate of operating surplus in agriculture in 2014 shows an annual increase of 4.6%. This follows an increase of 4.1% in 2013. The rise in operating surplus in 2014 can be mainly attributed to a decrease of 9.9% in the value of total intermediate consumption, primarily relating to expenditure on commercial feeding stuffs (-17.9%). See Table 1.
Further comparison of 2014 to 2013 shows the following changes in estimated values
These figures are based on the final annual data and update preliminary estimates published by the CSO in February 2015.
| This release introduces changes in methodology with respect to the valuation of fodder crops and certain items of intermediate consumption. The data for reference years 2010 - 2013 have also been revised. See Background Notes. |
| Table 1 Output, Input and Income in Agriculture, 2012 - 2014 | €m | ||||
| Description | Estimated Value (at current prices) | ||||
| 2012 | 2013 | 2014 | |||
| Livestock (incl. stock changes) | 3,065.0 | 3,151.5 | 3,064.4 | ||
| Cattle | 2,119.5 | 2,151.8 | 2,012.3 | ||
| Pigs | 441.5 | 475.7 | 471.3 | ||
| Sheep | 204.4 | 203.8 | 232.8 | ||
| Horses | 166.7 | 189.1 | 214.8 | ||
| Poultry | 132.9 | 131.1 | 133.3 | ||
| Livestock products | 1,693.3 | 2,133.6 | 2,152.9 | ||
| Milk | 1,629.8 | 2,073.4 | 2,093.4 | ||
| Other products | 63.5 | 60.1 | 59.4 | ||
| Crops (incl. stock changes) | 1,784.1 | 2,105.1 | 1,782.6 | ||
| Barley | 209.7 | 207.3 | 196.3 | ||
| Wheat | 100.8 | 57.4 | 69.4 | ||
| Oats | 24.4 | 24.9 | 14.8 | ||
| Potatoes | 103.3 | 164.5 | 87.6 | ||
| Mushrooms | 111.9 | 121.5 | 133.2 | ||
| Other fresh vegetables | 83.5 | 87.7 | 93.9 | ||
| Fresh fruit | 46.4 | 48.9 | 49.9 | ||
| Turf | 32.6 | 37.5 | 39.2 | ||
| Other crops | 64.3 | 60.1 | 59.0 | ||
| Forage plants | 1,007.2 | 1,295.3 | 1,039.3 | ||
| Goods output at producer prices | 6,542.4 | 7,390.1 | 6,999.8 | ||
| Contract work | 323.8 | 365.8 | 361.9 | ||
| Subsidies on products | 28.5 | 9.4 | 28.3 | ||
| Taxes on products | 56.7 | 49.8 | 62.5 | ||
| Agricultural output at basic prices | 6,838.1 | 7,715.4 | 7,327.5 | ||
| Intermediate consumption | 5,054.0 | 5,696.8 | 5,135.0 | ||
| Feedingstuffs | 1,442.4 | 1,610.7 | 1,322.0 | ||
| Fertilisers | 492.0 | 613.9 | 565.6 | ||
| Financial intermediation services indirectly measured (FISIM)1 | 44.3 | 50.3 | 46.5 | ||
| Seeds | 63.6 | 75.5 | 67.2 | ||
| Energy and lubricants | 443.2 | 452.6 | 450.2 | ||
| Maintenance and repairs | 445.8 | 441.4 | 449.1 | ||
| Other Goods and services | 444.4 | 453.5 | 478.5 | ||
| Crop protection products | 66.2 | 59.0 | 69.2 | ||
| Veterinary expenses | 282.6 | 285.1 | 290.4 | ||
| Forage plants | 1,005.6 | 1,289.0 | 1,034.5 | ||
| Contract work | 323.8 | 365.8 | 361.9 | ||
| Gross value added at basic prices | 1,784.2 | 2,018.6 | 2,192.4 | ||
| Fixed capital consumption | 716.8 | 702.9 | 729.2 | ||
| Machinery, equipment, etc. | 394.9 | 374.6 | 388.1 | ||
| Farm buildings | 321.9 | 328.3 | 341.1 | ||
| Net value added at basic prices | 1,067.4 | 1,315.7 | 1,463.2 | ||
| Other subsidies less taxes on production | 1,682.2 | 1,557.0 | 1,522.9 | ||
| Factor income | 2,749.6 | 2,872.7 | 2,986.1 | ||
| Compensation of employees | 454.6 | 482.5 | 486.9 | ||
| Operating surplus | 2,295.0 | 2,390.2 | 2,499.2 | ||
| Interest less FISIM | 309.7 | 300.7 | 279.8 | ||
| Land rental | 214.0 | 210.0 | 203.0 | ||
| Entrepreneurial income | 1,771.3 | 1,879.5 | 2,016.4 | ||
| 1FISIM : Financial Intermediation Services Indirectly Measured. (See Background Notes). | |||||
| Table 2 Selected Volume Indices, 2012 - 2014 | |||||
| Base year: 2010=100 | |||||
| Description | 2012 | 2013 | 2014 | ||
| Goods output at producer prices | 101.4 | 105.4 | 109.2 | ||
| Livestock1 | 105.6 | 105.6 | 110.2 | ||
| Cattle | 104.5 | 104.1 | 108.4 | ||
| Pigs | 108.9 | 111.9 | 116.1 | ||
| Sheep | 121.1 | 121.3 | 131.4 | ||
| Horses | 89.5 | 91.1 | 91.8 | ||
| Poultry | 109.2 | 102.1 | 108.0 | ||
| Livestock products | 100.9 | 104.8 | 108.8 | ||
| Milk | 100.1 | 104.4 | 108.4 | ||
| Crops1 | 96.1 | 105.7 | 108.3 | ||
| Barley | 130.8 | 161.8 | 167.1 | ||
| Wheat | 117.7 | 89.1 | 117.0 | ||
| Potatoes | 64.1 | 87.2 | 83.9 | ||
| Fresh vegetables | 104.2 | 112.6 | 118.3 | ||
| Intermediate consumption | 100.5 | 106.5 | 104.7 | ||
| Feedingstuffs | 112.7 | 114.9 | 104.3 | ||
| Fertilisers | 86.0 | 106.8 | 101.0 | ||
| Financial intermediation services indirectly measured (FISIM) | 72.4 | 81.4 | 74.3 | ||
| Seeds | 114.4 | 118.9 | 116.2 | ||
| Energy and lubricants | 94.7 | 98.0 | 100.2 | ||
| Maintenance and repairs | 107.8 | 107.6 | 109.0 | ||
| Other goods and services | 96.3 | 97.8 | 101.5 | ||
| Crop protection products | 124.9 | 110.1 | 128.9 | ||
| Veterinary expenses | 121.1 | 122.1 | 121.7 | ||
| Gross value added at basic prices | 101.9 | 100.8 | 122.5 | ||
| 1Including changes in stocks | |||||
This release contains final estimates of agricultural accounts for the reference year 2014. Three sets of estimates are prepared in each 12-month period. The first or Advance estimate is generally released in early December of the reference year, before the end of the reference year. This is based on the data available at the time, which is not fully complete. The Advance estimate is updated in February of the following year, when the Preliminary estimate is published. This incorporates all additional up-to-date information that has become available by that time. In June, the Final estimate of the agricultural accounts is prepared, based on the complete set of data. The methodology used for producing accounts for agriculture is based on the European System of Accounts (ESA 2010). For details of methodology and description of data sources please see the “Methodology” link.
Goods output at producer prices
This is the total output of goods produced and sold by the agricultural sector during the year valued at producer prices. It does not include the value of services provided, i.e. contract work.
Producer price
This is the price received by the farmer for his agricultural produce. It is sometimes referred to as the farm-gate or ex-farm price. It excludes VAT.
Agricultural output at basic prices
This is a sum of goods output plus the value of services provided (contract work) valued at basic prices.
Basic price
The basic price corresponds to the producer price plus any subsidies directly linked to a product minus any taxes on products. VAT is excluded.
Subsidies and taxes on products
Subsidies and taxes on agricultural products are those paid or levied per unit of a good or service produced or exported. Examples of subsidies on products are the suckler cow premium and the special beef premium. The bovine disease eradication levy is an example of a tax on products.
Contract work
Activities performed by agricultural contractors directly linked to the production of agricultural products (for example harvesting) are an integral part of agriculture. The value of such work is included as output and also as intermediate consumption. Estimates of the input costs incurred by agricultural contractors in the provision of agricultural services are included under the appropriate intermediate consumption categories, as well as in the compensation of employees figure.
Intermediate consumption
This is the value of all goods and services used as inputs in the production process excluding fixed assets (capital goods), whose consumption is recorded as fixed capital consumption (depreciation). Intermediate consumption excludes new or existing acquired fixed assets, e.g. tractors, agricultural machinery etc. They are recorded as gross fixed capital formation (GFCF). Intermediate consumption includes expenditure on contract work and forage plants, even if consumed within the same agricultural holding.
Forage plants
The production of forage plants is valued as part of output. Silage and hay are the main items in this category. Direct sales of cereals between farms and use of cereals within farms are also included under forage plants. These items are also treated as intermediate consumption with minor exceptions, such as sales of straw to racing stables.
FISIM
Financial intermediaries (mainly banks) charge explicit commissions and fees for their services to customers, as well as implicit ones by paying and charging different rates of interest to borrowers and lenders. The revenue from the margin on lending and borrowing by financial intermediaries is described as financial intermediation services indirectly measured (FISIM). The inclusion of FISIM in the table is in line with recommended EU national accounting conventions. It is a reallocation to intermediate consumption of part of the interest paid by farmers. While the inclusion of FISIM will increase intermediate consumption and decrease gross value added, it will decrease, by the same amount, the figure shown for interest paid.
Gross value added at basic prices
This is the difference between the output at basic prices and intermediate consumption. It is a measure of gross income before depreciation, subsidies and taxes and compensation of employees.
Net value added at basic prices
Net value added is calculated by subtracting expenditure on fixed capital consumption (depreciation) from gross value added.
Fixed capital consumption
This relates to the foreseeable wear and tear and obsolescence of fixed capital goods. It is calculated on the basis of the probable economic life of the asset. It is not calculated for breeding livestock or for non-produced assets such as land.
Factor Income
Factor income is a sum of net value added plus other subsidies on production less taxes on production. It is sometimes referred to as value added at factor cost.
Other subsidies and taxes on production
Other subsidies on production are subsidies other than those on products. Examples are the single farm payment scheme, the rural environmental protection scheme and the area based compensatory allowance scheme. Taxes on production consist of VAT over/under-compensation for farmers, who have opted for the flat rate VAT system, motor and machinery tax paid by farmers. Other subsidies less taxes on production are not included in the calculation of output but are included in the calculation of factor income and operating surplus.
Operating surplus
The operating surplus is calculated by subtracting compensation of employees from factor income. The figure is comprised of the operating surplus earned by farmers and that earned by agricultural contractors. It is an estimate of income before deductions for interest payments on borrowed capital, land annuities and rent paid by farmers to landowners for the use of their land.
Compensation of employees
This includes remuneration in cash and in kind. It does not include the remuneration of work undertaken by the farm owner or by non-salaried family members.
Entrepreneurial Income
Entrepreneurial income is comprised of operating surplus less interest payments on borrowed capital and land rental paid by farmers to landowners.
Valuation of stock changes
For each category, the difference between closing year stocks and opening year stocks is valued at the average producer price for the year.
Volume indices
To calculate the volume indices all items of output and input are valued at constant base year prices, i.e. by applying base year prices to current year quantities. The volume index for 2014 may then be calculated by comparing the value in 2014 at average 2010 prices to the value in 2010 at average 2010 prices. Volume indices allow one to estimate the changes in production and expenditure, as if the prices did not change since the base year. This separates the effects of volume and price changes on output, input and income.
Changes in methodology
This release introduces some changes in the methodology for estimating the value of the output of forage plants and to the method of calculating the expenditure on intermediate consumption by agricultural holdings. The details of the changes are outlined below.
a. Forage plants
Previously the price of silage, hay and straw was linked to the price of cereals. The new methodology uses prices obtained directly from the results of the National Farm Survey (NFS) run by Teagasc in order to obtain a more precise estimate.
b. Intermediate consumption
Certain items of intermediate consumption such as energy, maintenance and repairs and veterinary expenses are estimated by using results of the NFS. The new methodology continues to use NFS results but at a considerably more detailed level than previously, taking into account the type and size of the agricultural holdings. This allows for more precise estimates of farm input costs, especially for farms with small standard output, i.e. less than €8,000.
The new methodology has been applied in producing the Final estimates for the reference year 2014. The results for the years 2010 – 2013 has also been revised for comparability.
 Hide Background Notes
Scan the QR code below to view this release online or go to
http://www.cso.ie/en/releasesandpublications/er/oiiaf/outputinputandincomeinagriculture-finalestimate2014/
 Show Table 1 Output, Input and Income in Agriculture, 2012 - 2014
 Hide Table 1 Output, Input and Income in Agriculture, 2012 - 2014