| General Government Deficit, Gross Debt and Net Debt Q2 2014 | ||||||||
| General Government Surplus/Deficit | General Government Gross Debt | General Government Net Debt | ||||||
| €m | % quarterly GDP | €m | % annualised GDP | €m | % annualised GDP | |||
| 2013 Q1 | -3,289 | -7.8 | 218,358 | 125.7 | 154,500 | 88.9 | ||
| 2013 Q2 | -1,876 | -4.4 | 218,678 | 125.2 | 157,669 | 90.3 | ||
| 2013 Q3 | -2,854 | -6.4 | 218,543 | 124.2 | 157,706 | 89.6 | ||
| 2013 Q4 | -1,947 | -4.4 | 215,550 | 123.3 | 160,962 | 92.1 | ||
| 2014 Q1 | -3,082 | -7.0 | 215,077 | 121.9 | 161,114 | 91.4 | ||
| 2014 Q2 | -1,776 | -3.8 | 209,702 | 116.7 | 162,937 | 90.7 | ||
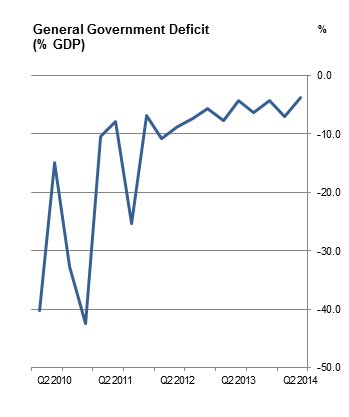
Government Deficit of 3.8% of quarterly GDP in Q2 2014
Ireland’s General Government Deficit (GG Deficit) amounted to €1,776 million in the second quarter of 2014 representing 3.8% of quarterly GDP. In the corresponding quarter of 2013, the deficit amounted to €1,876 million or 4.4% of quarterly GDP.
Ireland’s GG Deficit showed substantial variation during the quarters of 2010 and 2011, ranging from more than 42% of Q4 2010 GDP to 6.8% of Q4 2011 GDP, its lowest point in the period (see Figure 1 and Table 1). Since Q2 2012, the quarterly GG Deficit series has stabilised and shows reducing deficits.
Government revenue for Q2 2014 at €16,049 million was higher by €760 million than Q2 2013 revenue of €15,289 million, mainly due to increased revenue from taxes and social contributions. Government expenditure of €17,825 million in Q2 2014 reflected an increase of €660 million compared to Q2 2013 expenditure of €17,165, with reduced pay costs and depreciation offsetting increases in other expenditure categories (Table 1).
Ireland’s General Government Deficit amounted to €4,858 million for the first half of 2014, representing 5.4% of half-year GDP. The 2013 half-year deficit position was €5,165 million, or 6.1% of half-year GDP.
Ireland’s General Government Gross Debt (GG Debt) stood at €209,702 million or 116.7% of annualised GDP at the end of Q2 2014, compared to a level of €215,077 million or 121.9% of GDP at the end of Q1 2014.
General Government Net Debt amounted to €162,937 billion in Q2 2014, or 90.7% of GDP compared to €161,114 billion or 91.4% of GDP in Q1 2014 (Table 2).
The results in this release are presented under the new ESA 2010 standards. See box below and Background Notes for further information.
|
National accounts are compiled in the EU according to the European System of National and Regional Accounts (ESA) framework. In 2014, the new ESA 2010 framework replaced the previous ESA 95 version and all EU member states were required to adopt ESA 2010 by September 2014. Quarterly Government Finance Statistics were published for the first time according to the new standard in July of this year. Details of the main changes to government deficit and debt and their components due to the new standards are set out in the background notes to this release. The revised GDP figures under ESA 2010 also have an effect on the deficit and debt to GDP ratios when compared with the equivalent measures under ESA 95. This release is subject to the normal verification process of the Excessive Deficit Procedure by Eurostat until October 21st 2014, and should therefore be regarded as provisional.
|
| GG Gross Debt | GG Net Debt | |
| Q2 2010 | 74.8 | 52.1 |
| Q3 2010 | 83.8 | 59.8 |
| Q4 2010 | 87.4 | 67.5 |
| Q1 2011 | 94.4 | 68.3 |
| Q2 2011 | 95.3 | 70.7 |
| Q3 2011 | 112 | 77.4 |
| Q4 2011 | 111.1 | 79.1 |
| Q1 2012 | 113.4 | 81 |
| Q2 2012 | 117.5 | 85.4 |
| Q3 2012 | 123.6 | 86.4 |
| Q4 2012 | 121.7 | 87.9 |
| Q1 2013 | 125.7 | 88.9 |
| Q2 2013 | 125.2 | 90.3 |
| Q3 2013 | 124.2 | 89.6 |
| Q4 2013 | 123.3 | 92.1 |
| Q1 2014 | 121.9 | 91.4 |
| Q2 2014 | 116.7 | 90.7 |
| Table 1 General Government transactions: revenue, expenditure, financing and deficit | ||||||||||||||||||||||
| €million | ||||||||||||||||||||||
| Description | ESA2010 code | 2010 Q1 | 2010 Q2 | 2010 Q3 | 2010 Q4 | 2011 Q1 | 2011 Q2 | 2011 Q3 | 2011 Q4 | 2012 Q1 | 2012 Q2 | 2012 Q3 | 2012 Q4 | 2013 Q1 | 2013 Q2 | 2013 Q3 | 2013 Q4 | 2014 Q1 | 2014 Q2 | |||
| General Government transactions | ||||||||||||||||||||||
| Revenue | TR | 12,716 | 13,315 | 13,015 | 16,440 | 13,115 | 13,515 | 14,139 | 16,550 | 13,528 | 14,486 | 14,582 | 16,487 | 13,857 | 15,289 | 14,806 | 16,884 | 14,660 | 16,049 | |||
| Taxes and social contributions | D2 + D5 + D91 + D61 | 11,211 | 11,124 | 11,496 | 13,741 | 11,520 | 11,034 | 12,317 | 14,101 | 11,892 | 11,668 | 12,650 | 14,506 | 12,298 | 12,300 | 13,223 | 14,969 | 13,211 | 13,280 | |||
| Taxes | D2 + D5 + D91 | 8,721 | 8,769 | 9,364 | 11,235 | 8,885 | 8,598 | 9,945 | 11,572 | 9,599 | 9,269 | 10,322 | 11,874 | 9,757 | 9,786 | 10,738 | 12,208 | 10,445 | 10,651 | |||
| Social contributions | D61 | 2,491 | 2,356 | 2,132 | 2,507 | 2,635 | 2,437 | 2,372 | 2,528 | 2,293 | 2,399 | 2,327 | 2,632 | 2,542 | 2,514 | 2,485 | 2,761 | 2,766 | 2,628 | |||
| Sales of goods and services | P1O | 1,097 | 936 | 1,061 | 2,190 | 1,136 | 1,260 | 1,252 | 1,515 | 1,051 | 1,141 | 1,237 | 1,497 | 1,012 | 1,167 | 1,101 | 1,181 | 858 | 1,008 | |||
| Investment income | D4 | 270 | 1,115 | 337 | 389 | 263 | 1,134 | 489 | 559 | 461 | 1,587 | 594 | 381 | 458 | 1,746 | 405 | 533 | 505 | 1,686 | |||
| Current transfer revenue (excluding taxes) | D7 | 79 | 37 | 36 | 36 | 44 | 27 | 22 | 33 | 37 | 26 | 22 | 42 | 37 | 31 | 27 | 47 | 37 | 31 | |||
| Capital transfer revenue (excluding taxes) | D9N | 59 | 102 | 86 | 84 | 152 | 60 | 59 | 343 | 88 | 63 | 79 | 60 | 51 | 45 | 51 | 154 | 49 | 43 | |||
| Expenditure | TE | 29,265 | 19,507 | 26,736 | 33,446 | 17,389 | 16,942 | 25,082 | 19,496 | 17,989 | 18,181 | 17,768 | 19,046 | 17,147 | 17,165 | 17,661 | 18,832 | 17,742 | 17,825 | |||
| Expense | Expense | 28,851 | 19,296 | 26,368 | 32,068 | 17,369 | 17,049 | 24,968 | 18,494 | 17,723 | 18,004 | 18,347 | 18,637 | 17,455 | 17,518 | 18,116 | 18,391 | 17,357 | 17,561 | |||
| Compensation of employees | D1 | 4,829 | 4,636 | 4,764 | 5,064 | 4,876 | 4,682 | 4,749 | 4,868 | 4,920 | 4,647 | 4,683 | 4,656 | 4,848 | 4,747 | 4,559 | 4,498 | 4,698 | 4,601 | |||
| Use of goods and services plus taxes payable | P2 + D5 + D29 | 2,128 | 1,950 | 1,890 | 3,114 | 1,933 | 2,243 | 2,205 | 2,322 | 1,853 | 2,044 | 2,185 | 2,342 | 1,723 | 2,005 | 2,143 | 2,401 | 1,690 | 2,121 | |||
| Depreciation (Consumption of fixed capital) | P51c | 769 | 769 | 769 | 769 | 752 | 752 | 801 | 801 | 788 | 788 | 788 | 788 | 768 | 768 | 768 | 768 | 729 | 729 | |||
| Interest (excluding FISIM) | D41 | 1,163 | 1,090 | 1,588 | 1,079 | 1,191 | 1,267 | 1,822 | 1,608 | 1,637 | 1,735 | 1,899 | 1,886 | 1,957 | 1,885 | 1,925 | 1,891 | 1,864 | 1,909 | |||
| Subsidies | D3 | 431 | 386 | 420 | 552 | 363 | 358 | 385 | 478 | 327 | 346 | 368 | 506 | 321 | 339 | 361 | 487 | 312 | 329 | |||
| Social benefits | D62 + D631 | 6,932 | 7,253 | 7,229 | 7,359 | 6,979 | 7,093 | 7,341 | 7,382 | 7,045 | 7,282 | 7,540 | 7,539 | 6,806 | 7,017 | 7,334 | 7,446 | 6,962 | 7,054 | |||
| Other current transfers | D7 | 890 | 546 | 570 | 514 | 771 | 418 | 562 | 678 | 853 | 543 | 561 | 494 | 768 | 552 | 781 | 616 | 818 | 568 | |||
| Capital transfers | D9 | 11,708 | 2,666 | 9,138 | 13,617 | 505 | 237 | 7,103 | 357 | 300 | 617 | 323 | 426 | 265 | 205 | 246 | 284 | 283 | 251 | |||
| Net operating balance | NOB | -16,135 | -5,982 | -13,353 | -15,628 | -4,254 | -3,534 | -10,829 | -1,944 | -4,194 | -3,518 | -3,766 | -2,150 | -3,598 | -2,229 | -3,309 | -1,507 | -2,697 | -1,512 | |||
| Net acquisition of non-financial assets | P5 + NP - P51c | 413 | 210 | 368 | 1,378 | 20 | -108 | 114 | 1,002 | 267 | 177 | -580 | 408 | -309 | -353 | -455 | 441 | 385 | 264 | |||
| General Government Surplus/Deficit | B9 | -16,548 | -6,192 | -13,721 | -17,006 | -4,274 | -3,426 | -10,943 | -2,945 | -4,461 | -3,695 | -3,186 | -2,559 | -3,289 | -1,876 | -2,854 | -1,947 | -3,082 | -1,776 | |||
| equals | ||||||||||||||||||||||
| Net acquisition of financial assets | ΔFA | 4,598 | -7,122 | 3,028 | -12,003 | 8,345 | -1,882 | -341 | -2,046 | 1,406 | 348 | 7,915 | -3,959 | 6,051 | -2,627 | -1,391 | -7,083 | -2,236 | -6,614 | |||
| Debt instruments | F2 + F3 + F4 | 4,584 | -9,352 | 2,310 | -6,477 | 11,212 | -1,644 | -6,883 | -2,407 | 1,462 | -502 | 8,498 | -5,058 | 6,654 | -2,639 | -348 | -7,600 | -506 | -6,756 | |||
| Equity and Investment Fund Shares | F5 | 604 | 2,129 | 698 | -5,819 | -3,791 | 788 | 7,441 | -737 | -50 | 1,389 | 5 | 483 | 27 | 476 | -1,297 | -543 | -1,194 | 313 | |||
| Other financial assets | F6 + F7 + F8 | -590 | 101 | 20 | 293 | 924 | -1,026 | -899 | 1,098 | -6 | -539 | -588 | 616 | -630 | -464 | 254 | 1,060 | -536 | -171 | |||
| less | ||||||||||||||||||||||
| Net incurrence of liabilities | ΔL | 21,146 | -930 | 16,749 | 5,003 | 12,619 | 1,544 | 10,602 | 899 | 5,867 | 4,043 | 11,101 | -1,400 | 9,340 | -751 | 1,463 | -5,136 | 846 | -4,838 | |||
| Debt instruments | F2 + F3 + F4 | 20,142 | -1,456 | 16,793 | 5,373 | 11,404 | 1,801 | 10,742 | 1,801 | 4,761 | 4,411 | 11,436 | -1,311 | 10,025 | -652 | 1,102 | -4,768 | 347 | -4,565 | |||
| Other liabilities | F5 + F6 + F7 + F8 | 1,004 | 526 | -44 | -370 | 1,215 | -257 | -140 | -902 | 1,106 | -368 | -335 | -89 | -685 | -99 | 361 | -368 | 499 | -273 | |||
| Memo: Net derivative flows on debt interest swap contracts | 3 | 3 | 3 | 3 | -33 | -33 | -33 | -33 | -49 | -54 | -55 | -63 | -80 | -58 | -58 | -77 | -69 | -68 | ||||
| General Government Surplus/Deficit (% of quarterly GDP) | -40.3 | -14.8 | -32.7 | -42.4 | -10.5 | -7.9 | -25.3 | -6.8 | -10.8 | -8.8 | -7.3 | -5.6 | -7.8 | -4.4 | -6.4 | -4.4 | -7.0 | -3.8 | ||||
| Table 2 General Government Net Worth, Gross and Net Debt | ||||||||||||||||||||||||
| €million | ||||||||||||||||||||||||
| Description | ESA2010 code | 2010 Q1 | 2010 Q2 | 2010 Q3 | 2010 Q4 | 2011 Q1 | 2011 Q2 | 2011 Q3 | 2011 Q4 | 2012 Q1 | 2012 Q2 | 2012 Q3 | 2012 Q4 | 2013 Q1 | 2013 Q2 | 2013 Q3 | 2013 Q4 | 2014 Q1 | 2014 Q2 | |||||
| General Government net worth | ||||||||||||||||||||||||
| Net worth at market value, excluding pension liabilities | NW | 28,708 | 23,712 | 13,314 | 5,586 | 8,497 | 7,820 | -18,288 | -19,638 | -30,141 | -37,069 | -44,336 | -50,344 | -53,459 | -55,955 | -59,738 | -57,601 | -60,795 | -67,173 | |||||
| equals | ||||||||||||||||||||||||
| Non-financial assets at market value | NFA | 87,205 | 85,832 | 84,617 | 84,412 | 84,332 | 84,126 | 84,141 | 85,043 | 85,745 | 86,358 | 86,214 | 87,058 | 87,297 | 87,492 | 87,586 | 88,575 | 88,960 | 89,224 | |||||
| plus | ||||||||||||||||||||||||
| Financial net worth at market value, excluding pension liabilities | FNW | -58,497 | -62,120 | -71,303 | -78,826 | -75,835 | -76,306 | -102,429 | -104,681 | -115,886 | -123,427 | -130,550 | -137,402 | -140,756 | -143,447 | -147,324 | -146,176 | -149,755 | -156,397 | |||||
| equals | ||||||||||||||||||||||||
| Financial assets at market value | FA | 78,977 | 70,279 | 73,203 | 61,676 | 72,600 | 69,614 | 92,555 | 88,138 | 89,085 | 87,882 | 96,162 | 92,078 | 98,490 | 95,269 | 93,690 | 93,731 | 94,039 | 86,198 | |||||
| EDP debt instruments | F2 + F3 + F4 | 46,821 | 37,538 | 39,870 | 32,874 | 42,890 | 40,987 | 58,058 | 54,874 | 55,619 | 54,572 | 63,167 | 58,445 | 63,859 | 61,009 | 60,837 | 54,603 | 53,961 | 46,766 | |||||
| Equity and Investment Fund Shares | F5 | 23,394 | 24,207 | 25,020 | 20,130 | 20,106 | 20,010 | 24,689 | 22,975 | 23,465 | 23,714 | 23,906 | 24,601 | 26,498 | 26,685 | 24,810 | 29,865 | 31,454 | 31,416 | |||||
| Other financial assets | F6 + F7 + F8 | 8,762 | 8,534 | 8,313 | 8,672 | 9,604 | 8,617 | 9,808 | 10,289 | 10,001 | 9,596 | 9,089 | 9,032 | 8,133 | 7,575 | 8,043 | 9,263 | 8,624 | 8,016 | |||||
| less | ||||||||||||||||||||||||
| Liabilities at market value | L | 137,474 | 132,399 | 144,506 | 140,502 | 148,435 | 145,920 | 194,984 | 192,819 | 204,971 | 211,309 | 226,712 | 229,480 | 239,246 | 238,716 | 241,014 | 239,907 | 243,794 | 242,595 | |||||
| EDP debt instruments | F2 + F3 + F4 | 130,042 | 124,446 | 136,509 | 132,934 | 139,635 | 137,374 | 183,530 | 182,260 | 193,798 | 200,711 | 216,247 | 218,855 | 230,611 | 230,573 | 232,430 | 231,798 | 234,995 | 233,834 | |||||
| Other liabilities | F5 + F6 + F7 + F8 | 7,432 | 7,953 | 7,997 | 7,568 | 8,800 | 8,546 | 11,454 | 10,559 | 11,173 | 10,598 | 10,465 | 10,625 | 8,635 | 8,143 | 8,584 | 8,109 | 8,799 | 8,761 | |||||
| Memo: Estimated pension liabilities of government | 116,000 | 116,000 | 116,000 | 116,000 | 116,000 | 116,000 | 116,000 | 116,000 | 98,000 | 98,000 | 98,000 | 98,000 | 98,000 | 98,000 | 98,000 | 98,000 | 98,000 | 98,000 | ||||||
| Memo: Net worth, including pension liabilities | -87,292 | -92,288 | -102,686 | -110,414 | -107,503 | -108,180 | -134,288 | -135,638 | -128,141 | -135,069 | -142,336 | -148,344 | -151,459 | -153,955 | -157,738 | -155,601 | -158,795 | -165,173 | ||||||
| Contingent liabilities | 163,376 | 163,376 | 163,376 | 163,376 | 148,537 | 148,537 | 148,537 | 148,537 | 120,606 | 120,606 | 120,606 | 120,606 | 61,427 | 61,427 | 61,427 | 61,427 | 61,709 | 61,709 | ||||||
| Memo: Net worth, including pension liabilities and contingent liabilities | -250,668 | -255,664 | -266,062 | -273,791 | -256,039 | -256,717 | -282,825 | -284,174 | -248,747 | -255,675 | -262,942 | -268,950 | -212,885 | -215,381 | -219,165 | -217,028 | -220,503 | -226,882 | ||||||
| General Government: changes in net worth | ||||||||||||||||||||||||
| Opening net worth | 46,298 | 28,708 | 23,712 | 13,314 | 5,586 | 8,497 | 7,820 | -18,288 | -19,638 | -30,141 | -37,069 | -44,336 | -50,344 | -53,459 | -55,955 | -59,738 | -57,601 | -60,795 | ||||||
| Change in net worth due to transactions | -16,135 | -5,982 | -13,353 | -15,628 | -4,254 | -3,534 | -10,829 | -1,944 | -4,194 | -3,518 | -3,766 | -2,150 | -3,598 | -2,229 | -3,309 | -1,507 | -2,697 | -1,512 | ||||||
| Net acquisition of non-financial assets | P5 + NP - P51c | 413 | 210 | 368 | 1,378 | 20 | -108 | 114 | 1,002 | 267 | 177 | -580 | 408 | -309 | -353 | -455 | 441 | 385 | 264 | |||||
| Net lending/net borrowing | B9 | -16,548 | -6,192 | -13,721 | -17,006 | -4,274 | -3,426 | -10,943 | -2,945 | -4,461 | -3,695 | -3,186 | -2,559 | -3,289 | -1,876 | -2,854 | -1,947 | -3,082 | -1,776 | |||||
| Change in net worth due to other economic flows | Kx | -1,455 | 986 | 2,955 | 7,900 | 7,166 | 2,856 | -15,279 | 594 | -6,308 | -3,410 | -3,502 | -3,858 | 484 | -267 | -474 | 3,644 | -497 | -4,866 | |||||
| Other changes in non-financial assets | -1,583 | -1,583 | -1,583 | -1,583 | -99 | -99 | -99 | -99 | 435 | 435 | 435 | 435 | 548 | 548 | 548 | 548 | 0 | 0 | ||||||
| Other changes in financial assets | 1,690 | -1,576 | -104 | 476 | 2,579 | -1,104 | 23,282 | -2,371 | -459 | -1,551 | 365 | -125 | 361 | -594 | -188 | 7,124 | 2,544 | -1,227 | ||||||
| Other changes in liabilities | -1,562 | 4,145 | 4,642 | 9,007 | 4,686 | 4,059 | -38,462 | 3,064 | -6,285 | -2,295 | -4,302 | -4,168 | -426 | -221 | -835 | -4,029 | -3,041 | -3,639 | ||||||
| Closing net worth | 28,708 | 23,712 | 13,314 | 5,586 | 8,497 | 7,820 | -18,288 | -19,638 | -30,141 | -37,069 | -44,336 | -50,344 | -53,459 | -55,955 | -59,738 | -57,601 | -60,795 | -67,173 | ||||||
| General Government Debt (GGDebt) | ||||||||||||||||||||||||
| Debt instrument liabilities at market value | F2 + F3 + F4 | 130,042 | 124,446 | 136,509 | 132,934 | 139,635 | 137,374 | 183,530 | 182,260 | 193,798 | 200,711 | 216,247 | 218,855 | 230,611 | 230,573 | 232,430 | 231,798 | 234,995 | 233,834 | |||||
| + Difference between EDP face value and market value | -5,886 | -794 | 2,534 | 11,229 | 15,842 | 21,287 | 4,354 | 7,851 | 686 | -884 | -5,912 | -8,629 | -12,253 | -11,895 | -13,887 | -16,248 | -19,918 | -24,132 | ||||||
| Gross General Government Debt (EDP face value) | GGDebt | 124,156 | 123,652 | 139,043 | 144,163 | 155,477 | 158,661 | 187,884 | 190,111 | 194,484 | 199,827 | 210,335 | 210,226 | 218,358 | 218,678 | 218,543 | 215,550 | 215,077 | 209,702 | |||||
| less EDP debt instrument assets | F2 + F3 + F4 | -46,821 | -37,538 | -39,870 | -32,874 | -42,891 | -40,987 | -58,058 | -54,876 | -55,618 | -54,573 | -63,167 | -58,445 | -63,858 | -61,009 | -60,837 | -54,588 | -53,963 | -46,765 | |||||
| Net General Government Debt | GGNetDebt | 77,335 | 86,114 | 99,173 | 111,289 | 112,586 | 117,674 | 129,826 | 135,235 | 138,866 | 145,254 | 147,168 | 151,781 | 154,500 | 157,669 | 157,706 | 160,962 | 161,114 | 162,937 | |||||
| Closing Net Worth (% of annualised GDP) | 17.3 | 14.3 | 8 | 3.4 | 5.2 | 4.7 | -10.9 | -11.5 | -17.6 | -21.8 | -26 | -29.1 | -30.8 | -32 | -34.0 | -33.0 | -34.5 | -37.4 | ||||||
| Gross General Government Debt (% of annualised GDP) | 74.6 | 74.8 | 83.8 | 87.4 | 94.4 | 95.3 | 112 | 111.1 | 113.4 | 117.5 | 123.6 | 121.7 | 125.7 | 125.2 | 124.2 | 123.3 | 121.9 | 116.7 | ||||||
| Net General Government Debt (% of annualised GDP) | 46.5 | 52.1 | 59.8 | 67.5 | 68.3 | 70.7 | 77.4 | 79.1 | 81 | 85.4 | 86.4 | 87.9 | 88.9 | 90.3 | 89.6 | 92.1 | 91.4 | 90.7 | ||||||
| Table 3 General Government: detailed classification of revenue and output | |||||||||||||||||||||||
| €million | |||||||||||||||||||||||
| Description | ESA2010 code | 2010 Q1 | 2010 Q2 | 2010 Q3 | 2010 Q4 | 2011 Q1 | 2011 Q2 | 2011 Q3 | 2011 Q4 | 2012 Q1 | 2012 Q2 | 2012 Q3 | 2012 Q4 | 2013 Q1 | 2013 Q2 | 2013 Q3 | 2013 Q4 | 2014 Q1 | 2014 Q2 | ||||
| Total Revenue | TR | 12,716 | 13,315 | 13,015 | 16,440 | 13,115 | 13,515 | 14,139 | 16,550 | 13,528 | 14,486 | 14,582 | 16,487 | 13,857 | 15,289 | 14,806 | 16,884 | 14,660 | 16,049 | ||||
| Taxes and social contributions | 11,211 | 11,124 | 11,496 | 13,741 | 11,520 | 11,034 | 12,317 | 14,101 | 11,892 | 11,668 | 12,650 | 14,506 | 12,298 | 12,300 | 13,223 | 14,969 | 13,211 | 13,280 | |||||
| Taxes | D2 + D5 + D91 | 8,721 | 8,769 | 9,364 | 11,235 | 8,885 | 8,598 | 9,945 | 11,572 | 9,599 | 9,269 | 10,322 | 11,874 | 9,757 | 9,786 | 10,738 | 12,208 | 10,445 | 10,651 | ||||
| Indirect taxes (taxes on production and imports) | D2 | 4,701 | 3,748 | 5,327 | 4,183 | 4,771 | 3,613 | 5,017 | 4,197 | 4,858 | 3,748 | 5,393 | 4,188 | 5,031 | 3,951 | 5,580 | 4,457 | 5,449 | 4,499 | ||||
| Taxes on products | D21 | 4,223 | 3,273 | 4,857 | 3,723 | 4,290 | 3,135 | 4,544 | 3,730 | 4,328 | 3,222 | 4,871 | 3,671 | 4,533 | 3,330 | 5,010 | 3,848 | 4,695 | 3,874 | ||||
| of which Value-Added Tax | D211 | 2,933 | 1,868 | 3,147 | 2,120 | 2,966 | 1,748 | 2,931 | 2,110 | 3,050 | 1,860 | 3,149 | 2,161 | 3,025 | 1,812 | 3,434 | 2,100 | 3,201 | 2,165 | ||||
| Other taxes on production | D29 | 478 | 475 | 471 | 460 | 482 | 478 | 473 | 467 | 530 | 526 | 522 | 518 | 497 | 621 | 571 | 609 | 754 | 626 | ||||
| Direct taxes | D5 | 3,966 | 4,944 | 4,005 | 6,978 | 4,092 | 4,960 | 4,838 | 7,271 | 4,720 | 5,495 | 4,887 | 7,493 | 4,705 | 5,809 | 5,121 | 7,557 | 4,966 | 6,116 | ||||
| Taxes on income, profits and capital gains | D51 | 3,703 | 4,690 | 3,764 | 6,770 | 3,835 | 4,715 | 4,148 | 7,055 | 4,457 | 5,244 | 4,172 | 7,259 | 4,443 | 5,546 | 4,339 | 7,286 | 4,682 | 5,842 | ||||
| Other current direct taxes | D59 | 263 | 255 | 240 | 208 | 257 | 245 | 689 | 216 | 263 | 251 | 715 | 234 | 262 | 264 | 781 | 271 | 285 | 274 | ||||
| Capital taxes | D91 | 54 | 76 | 32 | 74 | 23 | 25 | 90 | 105 | 21 | 26 | 42 | 193 | 21 | 26 | 37 | 195 | 29 | 36 | ||||
| Social contributions | D61 | 2,491 | 2,356 | 2,132 | 2,507 | 2,635 | 2,437 | 2,372 | 2,528 | 2,293 | 2,399 | 2,327 | 2,632 | 2,542 | 2,514 | 2,485 | 2,761 | 2,766 | 2,628 | ||||
| Actual social contributions | D611 + D613 | 1,890 | 1,755 | 1,532 | 1,906 | 2,055 | 1,857 | 1,792 | 1,948 | 1,676 | 1,783 | 1,711 | 2,016 | 1,888 | 1,860 | 1,831 | 2,107 | 2,112 | 1,975 | ||||
| Employers' imputed social contributions | D612 | 600 | 600 | 600 | 600 | 580 | 580 | 580 | 580 | 616 | 616 | 616 | 616 | 654 | 654 | 654 | 654 | 654 | 654 | ||||
| Sales of goods and services | P1O | 1,097 | 936 | 1,061 | 2,190 | 1,136 | 1,260 | 1,252 | 1,515 | 1,051 | 1,141 | 1,237 | 1,497 | 1,012 | 1,167 | 1,101 | 1,181 | 858 | 1,008 | ||||
| Sales of market establishments (= market output) | P11 | 219 | 219 | 219 | 219 | 226 | 226 | 226 | 226 | 242 | 242 | 242 | 242 | 258 | 258 | 258 | 258 | 258 | 258 | ||||
| Imputed sales related to production of own-use capital assets (= output for own final use) | P12 | 14 | 14 | 14 | 14 | 14 | 14 | 14 | 14 | 9 | 9 | 9 | 9 | 8 | 8 | 8 | 8 | 8 | 8 | ||||
| Incidental sales and fees of non-market establishments | P131 | 864 | 703 | 827 | 1,956 | 895 | 1,019 | 1,011 | 1,274 | 799 | 890 | 985 | 1,246 | 746 | 901 | 834 | 915 | 592 | 742 | ||||
| Investment income | D4 | 270 | 1,115 | 337 | 389 | 263 | 1,134 | 489 | 559 | 461 | 1,587 | 594 | 381 | 458 | 1,746 | 405 | 533 | 505 | 1,686 | ||||
| Interest (excluding FISIM) | D41 | 214 | 193 | 217 | 226 | 250 | 270 | 462 | 378 | 369 | 454 | 408 | 358 | 400 | 318 | 327 | 320 | 313 | 279 | ||||
| Dividends | D42 | 56 | 922 | 120 | 162 | 12 | 863 | 26 | 180 | 91 | 1,132 | 185 | 22 | 58 | 1,426 | 76 | 212 | 191 | 1,407 | ||||
| Current transfer revenue | D39 + D7 | 79 | 37 | 36 | 36 | 44 | 27 | 22 | 33 | 37 | 26 | 22 | 42 | 37 | 31 | 27 | 47 | 37 | 31 | ||||
| Subsidies | D39 | 0 | 0 | 0 | 0 | 0 | 0 | 0 | 0 | 0 | 0 | 0 | 0 | 0 | 0 | 0 | 0 | 0 | 0 | ||||
| Other current transfers | D7 | 79 | 37 | 36 | 36 | 44 | 27 | 22 | 33 | 37 | 26 | 22 | 42 | 37 | 31 | 27 | 47 | 37 | 31 | ||||
| Non-life insurance claims | D72 | 4 | 4 | 4 | 4 | 3 | 3 | 3 | 3 | 4 | 4 | 4 | 4 | 3 | 3 | 3 | 3 | 3 | 3 | ||||
| Other Domestic - Current | D7N_S1 | 18 | 18 | 18 | 18 | 18 | 18 | 18 | 18 | 18 | 18 | 18 | 18 | 18 | 18 | 18 | 18 | 18 | 18 | ||||
| From Rest of World - Current | D7N_S2 | 57 | 15 | 14 | 14 | 22 | 6 | 1 | 11 | 16 | 5 | 1 | 21 | 16 | 10 | 6 | 26 | 16 | 10 | ||||
| Capital transfer revenue | D9N | 59 | 102 | 86 | 84 | 152 | 60 | 59 | 343 | 88 | 63 | 79 | 60 | 51 | 45 | 51 | 154 | 49 | 43 | ||||
| Output | P1 | 7,794 | 7,422 | 7,490 | 9,015 | 7,633 | 7,750 | 7,827 | 8,064 | 7,652 | 7,571 | 7,747 | 7,878 | 7,444 | 7,626 | 7,575 | 7,772 | 7,223 | 7,556 | ||||
| Market output (sales of market establishments) | P11 | 219 | 219 | 219 | 219 | 226 | 226 | 226 | 226 | 242 | 242 | 242 | 242 | 258 | 258 | 258 | 258 | 258 | 258 | ||||
| Output for own final use | P12 | 14 | 14 | 14 | 14 | 14 | 14 | 14 | 14 | 9 | 9 | 9 | 9 | 8 | 8 | 8 | 8 | 8 | 8 | ||||
| Non-market output | P13 | 7,560 | 7,188 | 7,257 | 8,781 | 7,392 | 7,509 | 7,586 | 7,823 | 7,401 | 7,319 | 7,496 | 7,626 | 7,178 | 7,359 | 7,309 | 7,506 | 6,957 | 7,290 | ||||
| = Non-market compensation of employees | D1_nonmarket | 4,815 | 4,621 | 4,749 | 5,049 | 4,861 | 4,667 | 4,734 | 4,854 | 4,911 | 4,638 | 4,674 | 4,647 | 4,839 | 4,739 | 4,551 | 4,490 | 4,690 | 4,592 | ||||
| = Total compensation of employees | D1 | 4,829 | 4,636 | 4,764 | 5,064 | 4,876 | 4,682 | 4,749 | 4,868 | 4,920 | 4,647 | 4,683 | 4,656 | 4,848 | 4,747 | 4,559 | 4,498 | 4,698 | 4,601 | ||||
| - Compensation of employees of market establishments | D1_market | ||||||||||||||||||||||
| - Compensation related to production of own-use capital assets | D1_own-use | -14 | -14 | -14 | -14 | -14 | -14 | -14 | -14 | -9 | -9 | -9 | -9 | -8 | -8 | -8 | -8 | -8 | -8 | ||||
| + Non-market intermediate consumption | P2_nonmarket | 2,072 | 1,894 | 1,834 | 3,058 | 1,876 | 2,186 | 2,148 | 2,265 | 1,800 | 1,991 | 2,131 | 2,289 | 1,670 | 1,952 | 2,090 | 2,348 | 1,637 | 2,068 | ||||
| = Total intermediate consumption | P2 | 2,128 | 1,949 | 1,890 | 3,114 | 1,932 | 2,242 | 2,204 | 2,322 | 1,853 | 2,044 | 2,185 | 2,342 | 1,723 | 2,005 | 2,143 | 2,401 | 1,690 | 2,121 | ||||
| - Intermediate consumption of market establishments | P2_market | -56 | -56 | -56 | -56 | -57 | -57 | -57 | -57 | -53 | -53 | -53 | -53 | -53 | -53 | -53 | -53 | -53 | -53 | ||||
| - Intermediate consumption related to production of own-use capital assets | P2_own-use | ||||||||||||||||||||||
| + Non-market consumption of fixed capital | P51c_nonmarket | 673 | 673 | 673 | 673 | 656 | 656 | 704 | 704 | 690 | 690 | 690 | 690 | 668 | 668 | 668 | 668 | 630 | 630 | ||||
| = Total consumption of fixed capital | P51c_nonmarket | 769 | 769 | 769 | 769 | 752 | 752 | 801 | 801 | 788 | 788 | 788 | 788 | 768 | 768 | 768 | 768 | 729 | 729 | ||||
| - Consumption of fixed capital by market establishments | P51c_market | -96 | -96 | -96 | -96 | -96 | -96 | -96 | -96 | -97 | -97 | -97 | -97 | -99 | -99 | -99 | -99 | -99 | -99 | ||||
| - Consumption of fixed capital related to production of own-use capital assets | P51c_own-use | ||||||||||||||||||||||
| + Other taxes on production, payable | D29_pay | 0 | 0 | 0 | 0 | 0 | 0 | 0 | 0 | 0 | 0 | 0 | 0 | 0 | 0 | 0 | 0 | 0 | 0 | ||||
| - Other subsidies on production, receivable | D39_rec | 0 | 0 | 0 | 0 | 0 | 0 | 0 | 0 | 0 | 0 | 0 | 0 | 0 | 0 | 0 | 0 | 0 | 0 | ||||
| Table 4 General Government: detailed classification of expenditure and consumption | |||||||||||||||||||||||
| €million | |||||||||||||||||||||||
| Description | ESA2010 code | 2010 Q1 | 2010 Q2 | 2010 Q3 | 2010 Q4 | 2011 Q1 | 2011 Q2 | 2011 Q3 | 2011 Q4 | 2012 Q1 | 2012 Q2 | 2012 Q3 | 2012 Q4 | 2013 Q1 | 2013 Q2 | 2013 Q3 | 2013 Q4 | 2014 Q1 | 2014 Q2 | ||||
| Total Expenditure | TE | 29,265 | 19,507 | 26,736 | 33,446 | 17,389 | 16,942 | 25,082 | 19,496 | 17,989 | 18,181 | 17,768 | 19,046 | 17,147 | 17,165 | 17,661 | 18,832 | 17,742 | 17,825 | ||||
| Expense | 28,851 | 19,296 | 26,368 | 32,068 | 17,369 | 17,049 | 24,968 | 18,494 | 17,723 | 18,004 | 18,347 | 18,637 | 17,455 | 17,518 | 18,116 | 18,391 | 17,357 | 17,561 | |||||
| Compensation of employees | D1 | 4,829 | 4,636 | 4,764 | 5,064 | 4,876 | 4,682 | 4,749 | 4,868 | 4,920 | 4,647 | 4,683 | 4,656 | 4,848 | 4,747 | 4,559 | 4,498 | 4,698 | 4,601 | ||||
| Of which: Related to production of own-use capital assets | 14 | 14 | 14 | 14 | 14 | 14 | 14 | 14 | 9 | 9 | 9 | 9 | 8 | 8 | 8 | 8 | 8 | 8 | |||||
| Use of goods and services plus taxes payable | P2 + D5 + D29 | 2,128 | 1,950 | 1,890 | 3,114 | 1,933 | 2,243 | 2,205 | 2,322 | 1,853 | 2,044 | 2,185 | 2,342 | 1,723 | 2,005 | 2,143 | 2,401 | 1,690 | 2,121 | ||||
| Use of goods and services [Intermediate consumption] | P2 | 2,128 | 1,949 | 1,890 | 3,114 | 1,932 | 2,242 | 2,204 | 2,322 | 1,853 | 2,044 | 2,185 | 2,342 | 1,723 | 2,005 | 2,143 | 2,401 | 1,690 | 2,121 | ||||
| Of which: Intermediate consumption of market establishments | 56 | 56 | 56 | 56 | 57 | 57 | 57 | 57 | 53 | 53 | 53 | 53 | 53 | 53 | 53 | 53 | 53 | 53 | |||||
| Taxes, payable | D5 | 0 | 0 | 0 | 0 | 0 | 0 | 0 | 0 | 0 | 0 | 0 | 0 | 0 | 0 | 0 | 0 | 0 | 0 | ||||
| Depreciation (Consumption of fixed capital) | P51c | 769 | 769 | 769 | 769 | 752 | 752 | 801 | 801 | 788 | 788 | 788 | 788 | 768 | 768 | 768 | 768 | 729 | 729 | ||||
| Of which: Depreciation by market establishments | 96 | 96 | 96 | 96 | 96 | 96 | 96 | 96 | 97 | 97 | 97 | 97 | 99 | 99 | 99 | 99 | 99 | 99 | |||||
| Interest (excluding FISIM) | D41 | 1,163 | 1,090 | 1,588 | 1,079 | 1,191 | 1,267 | 1,822 | 1,608 | 1,637 | 1,735 | 1,899 | 1,886 | 1,957 | 1,885 | 1,925 | 1,891 | 1,864 | 1,909 | ||||
| Subsidies | D3 | 431 | 386 | 420 | 552 | 363 | 358 | 385 | 478 | 327 | 346 | 368 | 506 | 321 | 339 | 361 | 487 | 312 | 329 | ||||
| Product subsidies | D31 | 270 | 220 | 285 | 308 | 239 | 246 | 274 | 301 | 219 | 240 | 261 | 315 | 218 | 237 | 258 | 247 | 212 | 230 | ||||
| Other subsidies on production | D39 | 161 | 166 | 135 | 244 | 124 | 113 | 111 | 176 | 108 | 107 | 108 | 192 | 103 | 102 | 103 | 241 | 100 | 99 | ||||
| Social benefits | D62 + D631 | 6,932 | 7,253 | 7,229 | 7,359 | 6,979 | 7,093 | 7,341 | 7,382 | 7,045 | 7,282 | 7,540 | 7,539 | 6,806 | 7,017 | 7,334 | 7,446 | 6,962 | 7,054 | ||||
| Social benefits in cash | D62 | 6,108 | 6,126 | 5,735 | 6,344 | 6,153 | 5,974 | 5,844 | 6,355 | 6,158 | 6,076 | 5,893 | 6,543 | 6,008 | 5,828 | 5,751 | 6,421 | 5,814 | 5,756 | ||||
| Social benefits in kind (via market producers) | D631 | 824 | 1,127 | 1,494 | 1,015 | 826 | 1,119 | 1,497 | 1,027 | 887 | 1,207 | 1,647 | 996 | 797 | 1,189 | 1,583 | 1,025 | 1,148 | 1,298 | ||||
| Other current transfers | D7 | 890 | 546 | 570 | 514 | 771 | 418 | 562 | 678 | 853 | 543 | 561 | 494 | 768 | 552 | 781 | 616 | 818 | 568 | ||||
| Net non-life insurance premiums | D71 | 18 | 18 | 18 | 18 | 18 | 18 | 18 | 18 | 23 | 23 | 23 | 23 | 23 | 23 | 23 | 23 | 23 | 23 | ||||
| Current international cooperation | D74 | 158 | 144 | 144 | 101 | 135 | 70 | 122 | 220 | 102 | 137 | 187 | 120 | 88 | 117 | 160 | 103 | 85 | 113 | ||||
| Miscellaneous current transfers | D75 | 249 | 193 | 111 | 180 | 165 | 140 | 152 | 202 | 246 | 148 | 117 | 115 | 123 | 113 | 297 | 110 | 124 | 115 | ||||
| VAT and GNI based EU budget contribution | D76 | 465 | 191 | 296 | 215 | 453 | 190 | 269 | 238 | 482 | 237 | 234 | 237 | 535 | 300 | 301 | 381 | 586 | 317 | ||||
| VAT-based EU own resources | D761 | 76 | 29 | 47 | 42 | 71 | 30 | 48 | 44 | 81 | 39 | 40 | 32 | 78 | 47 | 47 | 23 | 82 | 47 | ||||
| GNI-based EU own resources | D762 | 389 | 163 | 249 | 173 | 381 | 160 | 221 | 194 | 402 | 198 | 194 | 205 | 457 | 253 | 254 | 358 | 505 | 269 | ||||
| Capital transfers | D9 | 11,708 | 2,666 | 9,138 | 13,617 | 505 | 237 | 7,103 | 357 | 300 | 617 | 323 | 426 | 265 | 205 | 246 | 284 | 283 | 251 | ||||
| Investment grants | D92 | 491 | 99 | 558 | 154 | 498 | 124 | 102 | 357 | 300 | 337 | 323 | 426 | 265 | 205 | 246 | 284 | 283 | 251 | ||||
| Other capital transfers | D99 | 11,217 | 2,567 | 8,580 | 13,463 | 7 | 113 | 7,001 | 0 | 0 | 280 | 0 | 0 | 0 | 0 | 0 | 0 | 0 | 0 | ||||
| Net acquisition of non-financial assets | P5 + NP - P51c | 413 | 210 | 368 | 1,378 | 20 | -108 | 114 | 1,002 | 267 | 177 | -580 | 408 | -309 | -353 | -455 | 441 | 385 | 264 | ||||
| = Gross investment in non-financial assets | P5 + NP | 1,183 | 979 | 1,137 | 2,147 | 772 | 644 | 914 | 1,802 | 1,054 | 965 | 208 | 1,196 | 459 | 414 | 313 | 1,208 | 1,114 | 993 | ||||
| Gross fixed capital formation | P51 | 1,203 | 999 | 1,157 | 2,167 | 744 | 616 | 887 | 1,774 | 1,034 | 944 | 187 | 1,175 | 1,161 | 394 | 292 | 1,187 | 1,114 | 993 | ||||
| Net acquisition of stocks | P52 | -20 | -20 | -20 | -20 | 28 | 28 | 28 | 28 | 21 | 21 | 21 | 21 | 21 | 21 | 21 | 21 | 0 | 0 | ||||
| Net acquisition of unproduced assets | NP | 0 | 0 | 0 | 0 | 0 | 0 | 0 | 0 | 0 | 0 | 0 | 0 | -723 | 0 | 0 | 0 | 0 | 0 | ||||
| - Consumption of fixed capital | P51c | -769 | -769 | -769 | -769 | -752 | -752 | -801 | -801 | -788 | -788 | -788 | -788 | -768 | -768 | -768 | -768 | -729 | -729 | ||||
| Net expenditure on current goods and services | P3 excl. D631 | 6,697 | 6,486 | 6,430 | 6,825 | 6,497 | 6,489 | 6,575 | 6,549 | 6,602 | 6,430 | 6,511 | 6,380 | 6,431 | 6,459 | 6,475 | 6,591 | 6,365 | 6,548 | ||||
| = Output | P1 | 7,794 | 7,422 | 7,490 | 9,015 | 7,633 | 7,750 | 7,827 | 8,064 | 7,652 | 7,571 | 7,747 | 7,878 | 7,444 | 7,626 | 7,575 | 7,772 | 7,223 | 7,556 | ||||
| - Sales of goods and services | P11+P12+P131 | -1,097 | -936 | -1,061 | -2,190 | -1,136 | -1,260 | -1,252 | -1,515 | -1,051 | -1,141 | -1,237 | -1,497 | -1,012 | -1,167 | -1,101 | -1,181 | -858 | -1,008 | ||||
| Market output (sales of market establishments) | P11 | -219 | -219 | -219 | -219 | -226 | -226 | -226 | -226 | -242 | -242 | -242 | -242 | -258 | -258 | -258 | -258 | -258 | -258 | ||||
| Output for own final use | P12 | -14 | -14 | -14 | -14 | -14 | -14 | -14 | -14 | -9 | -9 | -9 | -9 | -8 | -8 | -8 | -8 | -8 | -8 | ||||
| Incidental sales and fees of non-market establishments | P131 | -864 | -703 | -827 | -1,956 | -895 | -1,019 | -1,011 | -1,274 | -799 | -890 | -985 | -1,246 | -746 | -901 | -834 | -915 | -592 | -742 | ||||
| Final consumption expenditure | P3 | 7,520 | 7,613 | 7,924 | 7,840 | 7,324 | 7,608 | 8,072 | 7,576 | 7,489 | 7,636 | 8,157 | 7,376 | 7,229 | 7,648 | 8,058 | 7,616 | 7,513 | 7,846 | ||||
| = Net expenditure on current goods and services | P3 excl. D631 | 6,697 | 6,486 | 6,430 | 6,825 | 6,497 | 6,489 | 6,575 | 6,549 | 6,602 | 6,430 | 6,511 | 6,380 | 6,431 | 6,459 | 6,475 | 6,591 | 6,365 | 6,548 | ||||
| + Social transfers in kind via market producers | D631 | 824 | 1,127 | 1,494 | 1,015 | 826 | 1,119 | 1,497 | 1,027 | 887 | 1,207 | 1,647 | 996 | 797 | 1,189 | 1,583 | 1,025 | 1,148 | 1,298 | ||||
| made up of | |||||||||||||||||||||||
| Individual consumption (= social transfers in kind) | P31 (= D63) | 5,185 | 5,246 | 5,596 | 5,291 | 5,068 | 5,273 | 5,680 | 5,001 | 5,075 | 5,182 | 5,712 | 4,906 | 4,839 | 5,248 | 5,652 | 5,167 | 5,148 | 5,413 | ||||
| Social transfers in kind (via market producers) | D631 | 824 | 1,127 | 1,494 | 1,015 | 826 | 1,119 | 1,497 | 1,027 | 887 | 1,207 | 1,647 | 996 | 797 | 1,189 | 1,583 | 1,025 | 1,148 | 1,298 | ||||
| Social transfers in kind (provided directly by government) | D632 | 4,361 | 4,119 | 4,102 | 4,276 | 4,242 | 4,154 | 4,183 | 3,974 | 4,187 | 3,975 | 4,065 | 3,910 | 4,042 | 4,059 | 4,069 | 4,142 | 4,000 | 4,115 | ||||
| Collective consumption (= actual final consumption of government) | P32 | 2,335 | 2,367 | 2,328 | 2,548 | 2,256 | 2,335 | 2,393 | 2,576 | 2,414 | 2,454 | 2,445 | 2,470 | 2,390 | 2,400 | 2,406 | 2,449 | 2,365 | 2,433 | ||||
| Total social transfers | D62 + D63 | 11,293 | 11,372 | 11,331 | 11,635 | 11,221 | 11,248 | 11,524 | 11,356 | 11,233 | 11,258 | 11,605 | 11,449 | 10,847 | 11,076 | 11,403 | 11,588 | 10,962 | 11,169 | ||||
| Social benefits in cash | D62 | 6,108 | 6,126 | 5,735 | 6,344 | 6,153 | 5,974 | 5,844 | 6,355 | 6,158 | 6,076 | 5,893 | 6,543 | 6,008 | 5,828 | 5,751 | 6,421 | 5,814 | 5,756 | ||||
| Social transfers in kind (= individual consumption) | D63 | 5,185 | 5,246 | 5,596 | 5,291 | 5,068 | 5,273 | 5,680 | 5,001 | 5,075 | 5,182 | 5,712 | 4,906 | 4,839 | 5,248 | 5,652 | 5,167 | 5,148 | 5,413 | ||||
| Table 5 General Government financial transactions | ||||||||||||||||||||||||
| €million | ||||||||||||||||||||||||
| 2010 Q1 | 2010 Q2 | 2010 Q3 | 2010 Q4 | 2011 Q1 | 2011 Q2 | 2011 Q3 | 2011 Q4 | 2012 Q1 | 2012 Q2 | 2012 Q3 | 2012 Q4 | 2013 Q1 | 2013 Q2 | 2013 Q3 | 2013 Q4 | 2014 Q1 | 2014 Q2 | |||||||
| Description | ESA2010 code | |||||||||||||||||||||||
| Net lending (+) / net borrowing (-) | B.9 | -16,548 | -6,192 | -13,721 | -17,006 | -4,274 | -3,426 | -10,943 | -2,945 | -4,461 | -3,695 | -3,186 | -2,559 | -3,289 | -1,876 | -2,854 | -1,947 | -3,082 | -1,776 | |||||
| equals | ||||||||||||||||||||||||
| Net acquisition of financial assets | ΔA | 4,598 | -7,122 | 3,028 | -12,003 | 8,345 | -1,882 | -341 | -2,046 | 1,406 | 348 | 7,915 | -3,959 | 6,051 | -2,627 | -1,391 | -7,083 | -2,236 | -6,614 | |||||
| EDP debt instruments | F2 + F3 + F4 | 4,584 | -9,352 | 2,310 | -6,477 | 11,212 | -1,644 | -6,883 | -2,407 | 1,462 | -502 | 8,498 | -5,058 | 6,654 | -2,639 | -348 | -7,600 | -506 | -6,756 | |||||
| Currency and deposits | F2 | 4,551 | -7,582 | 2,198 | -10,388 | 11,615 | 1,873 | -16,146 | 2,356 | 1,769 | 456 | 9,683 | -6,041 | 8,571 | -2,453 | -455 | -6,912 | 2,316 | -873 | |||||
| Debt securities | F3 | -121 | -1,785 | 117 | 3,646 | -632 | -3,657 | 2,819 | 822 | -1 | -116 | -123 | 1,197 | -860 | -108 | 333 | 241 | -123 | 62 | |||||
| Short-term | F31 | -46 | -2 | -9 | 20 | 0 | -1 | -8 | -27 | -9 | -3 | 0 | 1,046 | 945 | 1 | 1 | 1,750 | -201 | 126 | |||||
| Long-term | F32 | -75 | -1,783 | 126 | 3,626 | -632 | -3,656 | 2,827 | 849 | 8 | -113 | -123 | 151 | -1,805 | -109 | 332 | -1,509 | 78 | -64 | |||||
| Loans | F4 | 154 | 15 | -5 | 265 | 229 | 140 | 6,444 | -5,585 | -306 | -842 | -1,062 | -214 | -1,057 | -78 | -226 | -929 | -2,699 | -5,945 | |||||
| Short-term loans | F41 | 0 | 0 | 0 | 0 | 0 | 158 | 459 | 268 | 231 | -30 | 414 | 454 | -44 | -248 | 340 | 301 | 145 | 33 | |||||
| Long-term loans | F42 | 154 | 15 | -5 | 265 | 229 | -18 | 5,985 | -5,853 | -537 | -812 | -1,476 | -668 | -1,013 | 170 | -566 | -1,230 | -2,844 | -5,978 | |||||
| Equity and Investment Fund Shares | F5 | 604 | 2,129 | 698 | -5,819 | -3,791 | 788 | 7,441 | -737 | -50 | 1,389 | 5 | 483 | 27 | 476 | -1,297 | -543 | -1,194 | 313 | |||||
| Other financial assets | F6 + F7 + F8 | -590 | 101 | 20 | 293 | 924 | -1,026 | -899 | 1,098 | -6 | -539 | -588 | 616 | -630 | -464 | 254 | 1,060 | -536 | -171 | |||||
| Insurance, Pensions and Standardised Guarantees | F6 | 0 | 0 | 0 | 0 | 0 | 0 | 0 | 0 | 0 | 0 | 0 | -1 | 0 | 0 | 0 | 0 | 0 | 0 | |||||
| Financial derivatives and Employee Stock Options | F7 | 0 | 99 | 195 | -40 | -40 | -232 | 0 | 1 | -75 | 0 | 0 | 0 | 164 | 0 | 0 | 32 | 17 | 27 | |||||
| Other accounts receivable/payable | F8 | -590 | 2 | -175 | 333 | 964 | -794 | -899 | 1,097 | 69 | -539 | -588 | 617 | -794 | -464 | 254 | 1,028 | -553 | -198 | |||||
| less | ||||||||||||||||||||||||
| Net incurrence of liabilities | ΔL | 21,146 | -930 | 16,749 | 5,003 | 12,619 | 1,544 | 10,602 | 899 | 5,867 | 4,043 | 11,101 | -1,400 | 9,340 | -751 | 1,463 | -5,136 | 846 | -4,838 | |||||
| EDP debt instruments | F2 + F3 + F4 | 20,142 | -1,456 | 16,793 | 5,373 | 11,404 | 1,801 | 10,742 | 1,801 | 4,761 | 4,411 | 11,436 | -1,311 | 10,025 | -652 | 1,102 | -4,768 | 347 | -4,565 | |||||
| Currency and deposits | F2 | 722 | 926 | 970 | 804 | 833 | 374 | 5,590 | -3,904 | 939 | 2,681 | -534 | 716 | -30,613 | 575 | 172 | -841 | -2,842 | -6,962 | |||||
| Debt securities | F3 | 8,816 | -4,675 | 7,143 | -5,106 | -5,193 | -2,883 | 1,813 | -2,602 | -6,015 | -3,675 | 6,593 | -4,549 | 39,379 | -5,067 | -1,111 | -7,442 | 2,123 | 1,092 | |||||
| Short-term | F31 | -1,981 | -7,641 | 1,600 | -5,153 | -5,243 | -1,415 | 34 | 3,130 | -384 | 483 | 1,031 | -2,409 | 2,317 | 637 | -1,432 | -1,682 | 111 | 1,022 | |||||
| Long-term | F32 | 10,797 | 2,966 | 5,543 | 47 | 50 | -1,468 | 1,779 | -5,732 | -5,631 | -4,158 | 5,562 | -2,140 | 37,062 | -5,704 | 321 | -5,760 | 2,012 | 70 | |||||
| Loans | F4 | 10,604 | 2,293 | 8,680 | 9,675 | 15,764 | 4,310 | 3,339 | 8,307 | 9,837 | 5,405 | 5,377 | 2,522 | 1,259 | 3,840 | 2,041 | 3,515 | 1,066 | 1,305 | |||||
| Short-term loans | F41 | 65 | -282 | -148 | 393 | -43 | -175 | -80 | 133 | 11 | 1,257 | 409 | -340 | -50 | -397 | -244 | 233 | 94 | -48 | |||||
| Long-term loans | F42 | 10,539 | 2,575 | 8,828 | 9,282 | 15,807 | 4,485 | 3,419 | 8,174 | 9,826 | 4,148 | 4,968 | 2,862 | 1,309 | 4,237 | 2,285 | 3,282 | 972 | 1,353 | |||||
| Other liabilities | F5 + F6 + F7 + F8 | 1,004 | 526 | -44 | -370 | 1,215 | -257 | -140 | -902 | 1,106 | -368 | -335 | -89 | -685 | -99 | 361 | -368 | 499 | -273 | |||||
| Equity and Investment Fund Shares | F5 | 0 | 0 | 0 | 0 | 0 | 0 | 0 | 0 | 0 | 0 | 0 | 0 | 0 | 0 | 0 | 0 | 0 | 0 | |||||
| Insurance, Pensions and Standardised Guarantees | F6 | 0 | 0 | 0 | 0 | 0 | 0 | 0 | 0 | 0 | 0 | 0 | 1 | 0 | 0 | 0 | -1 | 0 | 0 | |||||
| Financial derivatives and Employee Stock Options | F7 | 0 | 0 | 0 | 0 | 0 | 0 | 0 | 3 | 0 | 0 | 0 | 0 | 0 | 0 | 0 | 0 | 0 | 0 | |||||
| Other accounts receivable/payable | F8 | 1,004 | 526 | -44 | -370 | 1,215 | -257 | -140 | -905 | 1,106 | -368 | -335 | -90 | -685 | -99 | 361 | -367 | 499 | -273 | |||||
| Table 6 General Government: detailed breakdown of net worth | |||||||||||||||||||||||||
| €million | |||||||||||||||||||||||||
| Description | ESA2010 code | 2010 Q1 | 2010 Q2 | 2010 Q3 | 2010 Q4 | 2011 Q1 | 2011 Q2 | 2011 Q3 | 2011 Q4 | 2012 Q1 | 2012 Q2 | 2012 Q3 | 2012 Q4 | 2013 Q1 | 2013 Q2 | 2013 Q3 | 2013 Q4 | 2014 Q1 | 2014 Q2 | ||||||
| General Government balance sheet | |||||||||||||||||||||||||
| Net worth at market value, excluding pension liabilities | NW | 28,708 | 23,712 | 13,314 | 5,586 | 8,497 | 7,820 | -18,288 | -19,638 | -30,141 | -37,069 | -44,336 | -50,344 | -53,459 | -55,955 | -59,738 | -57,601 | -60,795 | -67,173 | ||||||
| equals | |||||||||||||||||||||||||
| Non-financial assets at market value | NFA | 87,205 | 85,832 | 84,617 | 84,412 | 84,332 | 84,126 | 84,141 | 85,043 | 85,745 | 86,358 | 86,214 | 87,058 | 87,297 | 87,492 | 87,586 | 88,575 | 88,960 | 89,224 | ||||||
| plus | |||||||||||||||||||||||||
| Financial net worth at market value, excluding pension liabilities | FNW | -58,497 | -62,120 | -71,303 | -78,826 | -75,835 | -76,306 | -102,429 | -104,681 | -115,886 | -123,427 | -130,550 | -137,402 | -140,756 | -143,447 | -147,324 | -146,176 | -149,755 | -156,397 | ||||||
| equals | |||||||||||||||||||||||||
| Financial assets at market value | FA | 78,977 | 70,279 | 73,203 | 61,676 | 72,600 | 69,614 | 92,555 | 88,138 | 89,085 | 87,882 | 96,162 | 92,078 | 98,490 | 95,269 | 93,690 | 93,731 | 94,039 | 86,198 | ||||||
| EDP debt instruments | F2 + F3 + F4 | 46,821 | 37,538 | 39,870 | 32,874 | 42,890 | 40,987 | 58,058 | 54,874 | 55,619 | 54,572 | 63,167 | 58,445 | 63,859 | 61,009 | 60,837 | 54,603 | 53,961 | 46,766 | ||||||
| Currency and deposits | F2 | 34,719 | 27,141 | 29,369 | 19,020 | 30,632 | 32,504 | 16,633 | 18,990 | 20,758 | 21,215 | 30,898 | 25,018 | 33,590 | 31,135 | 30,680 | 23,767 | 26,083 | 25,221 | ||||||
| Debt securities | F3 | 8,646 | 6,923 | 7,029 | 10,114 | 8,289 | 4,374 | 7,085 | 7,919 | 8,069 | 8,021 | 7,926 | 9,470 | 8,610 | 8,487 | 8,821 | 10,450 | 10,347 | 10,445 | ||||||
| Short-term | F31 | 39 | 38 | 29 | 49 | 49 | 48 | 40 | 13 | 3 | 0 | 0 | 1,046 | 1,990 | 1,991 | 1,992 | 3,744 | 3,542 | 3,667 | ||||||
| Long-term | F32 | 8,607 | 6,885 | 7,000 | 10,065 | 8,241 | 4,326 | 7,045 | 7,907 | 8,066 | 8,021 | 7,926 | 8,424 | 6,619 | 6,496 | 6,829 | 6,706 | 6,806 | 6,777 | ||||||
| Loans | F4 | 3,456 | 3,474 | 3,472 | 3,740 | 3,969 | 4,109 | 34,340 | 27,965 | 26,792 | 25,336 | 24,343 | 23,957 | 21,659 | 21,387 | 21,336 | 20,386 | 17,531 | 11,100 | ||||||
| Short-term loans | F41 | 0 | 0 | 0 | 0 | 0 | 158 | 617 | 885 | 1,116 | 1,087 | 1,500 | 1,954 | 1,909 | 1,662 | 2,002 | 2,288 | 2,449 | 2,482 | ||||||
| Long-term loans | F42 | 3,456 | 3,474 | 3,472 | 3,740 | 3,969 | 3,951 | 33,723 | 27,081 | 25,675 | 24,250 | 22,843 | 22,003 | 19,750 | 19,725 | 19,334 | 18,083 | 15,083 | 8,618 | ||||||
| Equity and Investment Fund Shares | F5 | 23,394 | 24,207 | 25,020 | 20,130 | 20,106 | 20,010 | 24,689 | 22,975 | 23,465 | 23,714 | 23,906 | 24,601 | 26,498 | 26,685 | 24,810 | 29,865 | 31,454 | 31,416 | ||||||
| Other financial assets | F6 + F7 + F8 | 8,762 | 8,534 | 8,313 | 8,672 | 9,604 | 8,617 | 9,808 | 10,289 | 10,001 | 9,596 | 9,089 | 9,032 | 8,133 | 7,575 | 8,043 | 9,263 | 8,624 | 8,016 | ||||||
| Insurance, Pensions and Standardised Guarantees | F6 | 1 | 1 | 1 | 1 | 1 | 1 | 1 | 1 | 1 | 1 | 1 | 0 | 0 | 0 | 0 | 0 | 0 | 0 | ||||||
| Financial derivatives and Employee Stock Options | F7 | 844 | 616 | 571 | 606 | 575 | 381 | 2,296 | 1,694 | 1,339 | 1,474 | 1,557 | 898 | 794 | 701 | 915 | 1,136 | 1,049 | 640 | ||||||
| Other accounts receivable/payable | F8 | 7,917 | 7,917 | 7,741 | 8,065 | 9,028 | 8,235 | 7,511 | 8,594 | 8,661 | 8,121 | 7,531 | 8,134 | 7,339 | 6,874 | 7,128 | 8,127 | 7,575 | 7,376 | ||||||
| less | |||||||||||||||||||||||||
| Liabilities at market value | L | 137,474 | 132,399 | 144,506 | 140,502 | 148,435 | 145,920 | 194,984 | 192,819 | 204,971 | 211,309 | 226,712 | 229,480 | 239,246 | 238,716 | 241,014 | 239,907 | 243,794 | 242,595 | ||||||
| EDP debt instruments | F2 + F3 + F4 | 130,042 | 124,446 | 136,509 | 132,934 | 139,635 | 137,374 | 183,530 | 182,260 | 193,798 | 200,711 | 216,247 | 218,855 | 230,611 | 230,573 | 232,430 | 231,798 | 234,995 | 233,834 | ||||||
| Currency and deposits | F2 | 11,029 | 11,896 | 12,850 | 13,711 | 14,472 | 14,791 | 62,192 | 58,388 | 59,346 | 62,020 | 61,468 | 62,099 | 31,453 | 32,035 | 32,181 | 31,356 | 28,525 | 21,572 | ||||||
| Debt securities | F3 | 105,038 | 96,293 | 98,714 | 84,048 | 74,744 | 67,628 | 90,876 | 85,182 | 85,913 | 83,126 | 94,730 | 94,274 | 135,234 | 130,577 | 130,009 | 126,288 | 131,281 | 135,408 | ||||||
| Short-term | F31 | 18,217 | 10,891 | 12,497 | 7,231 | 2,089 | 741 | 717 | 3,796 | 3,520 | 4,039 | 5,052 | 2,572 | 4,969 | 5,587 | 4,128 | 2,423 | 2,513 | 3,508 | ||||||
| Long-term | F32 | 86,822 | 85,402 | 86,217 | 76,817 | 72,654 | 66,887 | 90,159 | 81,386 | 82,393 | 79,086 | 89,679 | 91,703 | 130,264 | 124,991 | 125,880 | 123,865 | 128,768 | 131,900 | ||||||
| Loans | F4 | 13,975 | 16,257 | 24,945 | 35,175 | 50,419 | 54,955 | 30,462 | 38,690 | 48,539 | 55,565 | 60,049 | 62,482 | 63,924 | 67,961 | 70,240 | 74,154 | 75,189 | 76,854 | ||||||
| Short-term loans | F41 | 773 | 490 | 342 | 735 | 691 | 516 | 436 | 569 | 580 | 1,838 | 2,246 | 1,907 | 1,856 | 1,460 | 1,216 | 1,468 | 1,559 | 1,485 | ||||||
| Long-term loans | F42 | 13,202 | 15,767 | 24,603 | 34,441 | 49,727 | 54,439 | 30,026 | 38,121 | 47,959 | 53,728 | 57,803 | 60,575 | 62,067 | 66,502 | 69,025 | 72,671 | 73,630 | 75,369 | ||||||
| Other liabilities | F5 + F6 + F7 + F8 | 7,432 | 7,953 | 7,997 | 7,568 | 8,800 | 8,546 | 11,454 | 10,559 | 11,173 | 10,598 | 10,465 | 10,625 | 8,635 | 8,143 | 8,584 | 8,109 | 8,799 | 8,761 | ||||||
| Equity and Investment Fund Shares | F5 | 0 | 0 | 0 | 0 | 0 | 0 | 0 | 0 | 0 | 0 | 0 | 0 | 0 | 0 | 0 | 0 | 0 | 0 | ||||||
| Insurance, Pensions and Standardised Guarantees | F6 | 0 | 0 | 0 | 0 | 0 | 0 | 0 | 0 | 0 | 0 | 0 | 1 | 1 | 1 | 1 | 0 | 0 | 0 | ||||||
| Financial derivatives and Employee Stock Options | F7 | 14 | 9 | 97 | 38 | 55 | 58 | 2,964 | 2,974 | 2,483 | 2,276 | 2,478 | 2,727 | 1,422 | 1,029 | 1,108 | 1,001 | 1,192 | 1,427 | ||||||
| Other accounts receivable/payable | F8 | 7,418 | 7,944 | 7,900 | 7,530 | 8,745 | 8,488 | 8,490 | 7,585 | 8,690 | 8,322 | 7,987 | 7,897 | 7,212 | 7,113 | 7,475 | 7,108 | 7,607 | 7,334 | ||||||
| Memo: Estimated pension liabilities of government | 116,000 | 116,000 | 116,000 | 116,000 | 116,000 | 116,000 | 116,000 | 116,000 | 98,000 | 98,000 | 98,000 | 98,000 | 98,000 | 98,000 | 98,000 | 98,000 | 98,000 | 98,000 | |||||||
| Memo: Net worth, including pension liabilities | -87,292 | -92,288 | -102,686 | -110,414 | -107,503 | -108,180 | -134,288 | -135,638 | -128,141 | -135,069 | -142,336 | -148,344 | -151,459 | -153,955 | -157,738 | -155,601 | -158,795 | -165,173 | |||||||
| Contingent liabilities | 163,376 | 163,376 | 163,376 | 163,376 | 148,537 | 148,537 | 148,537 | 148,537 | 120,606 | 120,606 | 120,606 | 120,606 | 61,427 | 61,427 | 61,427 | 61,427 | 61,709 | 61,709 | |||||||
| Guarantees | 158,327 | 158,327 | 158,327 | 158,327 | 143,488 | 143,488 | 143,488 | 143,488 | 115,557 | 115,557 | 115,557 | 115,557 | 56,182 | 56,182 | 56,182 | 56,182 | 56,182 | 56,182 | |||||||
| Off-balance sheet PPPs | 5,049 | 5,049 | 5,049 | 5,049 | 5,049 | 5,049 | 5,049 | 5,049 | 5,049 | 5,049 | 5,049 | 5,049 | 5,245 | 5,245 | 5,245 | 5,245 | 5,527 | 5,527 | |||||||
| Memo: Net worth, including pension liabilities and contingent liabilities | -250,668 | -255,664 | -266,062 | -273,791 | -256,039 | -256,717 | -282,825 | -284,174 | -248,747 | -255,675 | -262,942 | -268,950 | -212,885 | -215,381 | -219,165 | -217,028 | -220,503 | -226,882 | |||||||
| Change in net worth of government | |||||||||||||||||||||||||
| Opening net worth | 46,298 | 28,708 | 23,712 | 13,314 | 5,586 | 8,497 | 7,820 | -18,288 | -19,638 | -30,141 | -37,069 | -44,336 | -50,344 | -53,459 | -55,955 | -59,738 | -57,601 | -60,795 | |||||||
| Change in net worth due to transactions | -16,135 | -5,982 | -13,353 | -15,628 | -4,254 | -3,534 | -10,829 | -1,944 | -4,194 | -3,518 | -3,766 | -2,150 | -3,598 | -2,229 | -3,309 | -1,507 | -2,697 | -1,512 | |||||||
| Net acquisition of non-financial assets | P5 + NP - P51c | 413 | 210 | 368 | 1,378 | 20 | -108 | 114 | 1,002 | 267 | 177 | -580 | 408 | -309 | -353 | -455 | 441 | 385 | 264 | ||||||
| Net lending/net borrowing | B9 | -16,548 | -6,192 | -13,721 | -17,006 | -4,274 | -3,426 | -10,943 | -2,945 | -4,461 | -3,695 | -3,186 | -2,559 | -3,289 | -1,876 | -2,854 | -1,947 | -3,082 | -1,776 | ||||||
| = Net acquisition of financial assets | 4,598 | -7,122 | 3,028 | -12,003 | 8,345 | -1,882 | -341 | -2,046 | 1,406 | 348 | 7,915 | -3,959 | 6,051 | -2,627 | -1,391 | -7,083 | -2,236 | -6,614 | |||||||
| - Net incurrence of liabilities | -21,146 | 930 | -16,749 | -5,003 | -12,619 | -1,544 | -10,602 | -899 | -5,867 | -4,043 | -11,101 | 1,400 | -9,340 | 751 | -1,463 | 5,136 | -846 | 4,838 | |||||||
| Change in net worth due to other economic flows | Kx | -1,455 | 986 | 2,955 | 7,900 | 7,166 | 2,856 | -15,279 | 594 | -6,308 | -3,410 | -3,502 | -3,858 | 484 | -267 | -474 | 3,644 | -497 | -4,866 | ||||||
| Other changes in non-financial assets | -1,583 | -1,583 | -1,583 | -1,583 | -99 | -99 | -99 | -99 | 435 | 435 | 435 | 435 | 548 | 548 | 548 | 548 | 0 | 0 | |||||||
| Other changes in financial net worth | 128 | 2,569 | 4,538 | 9,483 | 7,265 | 2,955 | -15,180 | 693 | -6,744 | -3,846 | -3,937 | -4,293 | -65 | -815 | -1,023 | 3,095 | -497 | -4,866 | |||||||
| = Other changes in financial assets | 1,690 | -1,576 | -104 | 476 | 2,579 | -1,104 | 23,282 | -2,371 | -459 | -1,551 | 365 | -125 | 361 | -594 | -188 | 7,124 | 2,544 | -1,227 | |||||||
| EDP debt instruments | 256 | 69 | 22 | -519 | -1,196 | -259 | 23,954 | -777 | -717 | -545 | 97 | 336 | -1,240 | -211 | 176 | 1,366 | -136 | -439 | |||||||
| Equity and Investment Fund Shares | 1,002 | -1,316 | 115 | 929 | 3,767 | -884 | -2,762 | -977 | 540 | -1,140 | 187 | 212 | 1,870 | -289 | -578 | 5,598 | 2,783 | -351 | |||||||
| Other financial assets | 432 | -329 | -241 | 66 | 8 | 39 | 2,090 | -617 | -282 | 134 | 81 | -673 | -269 | -94 | 214 | 160 | -103 | -437 | |||||||
| - Other changes in liabilities | -1,562 | 4,145 | 4,642 | 9,007 | 4,686 | 4,059 | -38,462 | 3,064 | -6,285 | -2,295 | -4,302 | -4,168 | -426 | -221 | -835 | -4,029 | -3,041 | -3,639 | |||||||
| EDP debt instruments | -1,565 | 4,140 | 4,730 | 8,948 | 4,703 | 4,062 | -35,414 | 3,071 | -6,777 | -2,502 | -4,100 | -3,919 | -1,731 | -614 | -755 | -4,136 | -2,850 | -3,404 | |||||||
| Other liabilities | 3 | 5 | -88 | 59 | -17 | -3 | -3,048 | -7 | 492 | 207 | -202 | -249 | 1,305 | 393 | -80 | 107 | -191 | -235 | |||||||
| Closing net worth | 28,708 | 23,712 | 13,314 | 5,586 | 8,497 | 7,820 | -18,288 | -19,638 | -30,141 | -37,069 | -44,336 | -50,344 | -53,459 | -55,955 | -59,738 | -57,601 | -60,795 | -67,173 | |||||||
| Table 7 General Government Gross and Net Debt | ||||||||||||||||||||||
| €million | ||||||||||||||||||||||
| Description | ESA2010 code | 2010 Q1 | 2010 Q2 | 2010 Q3 | 2010 Q4 | 2011 Q1 | 2011 Q2 | 2011 Q3 | 2011 Q4 | 2012 Q1 | 2012 Q2 | 2012 Q3 | 2012 Q4 | 2013 Q1 | 2013 Q2 | 2013 Q3 | 2013 Q4 | 2014 Q1 | 2014 Q2 | |||
| General Government Debt | ||||||||||||||||||||||
| Debt instrument liabilities at market value | 130,042 | 124,446 | 136,509 | 132,934 | 139,635 | 137,374 | 183,530 | 182,260 | 193,798 | 200,711 | 216,247 | 218,855 | 230,611 | 230,573 | 232,430 | 231,798 | 234,995 | 233,834 | ||||
| + Difference between face value and market value | -5,886 | -794 | 2,534 | 11,229 | 15,842 | 21,287 | 4,354 | 7,851 | 686 | -884 | -5,912 | -8,629 | -12,253 | -11,895 | -13,887 | -16,248 | -19,918 | -24,132 | ||||
| Gross General Government Debt (face value) | GGDebt | 124,156 | 123,652 | 139,043 | 144,163 | 155,477 | 158,661 | 187,884 | 190,111 | 194,484 | 199,827 | 210,335 | 210,226 | 218,358 | 218,678 | 218,543 | 215,550 | 215,077 | 209,702 | |||
| By category: | ||||||||||||||||||||||
| Currency and deposits | F2 | 11,029 | 11,896 | 12,850 | 13,708 | 14,472 | 14,791 | 62,192 | 58,386 | 59,346 | 62,020 | 61,468 | 62,092 | 31,453 | 32,035 | 32,181 | 31,356 | 28,525 | 21,572 | |||
| Debt securities | F3 | 99,657 | 95,991 | 101,729 | 96,317 | 91,471 | 89,731 | 96,241 | 94,001 | 87,676 | 84,928 | 90,408 | 87,285 | 124,566 | 120,426 | 118,269 | 112,660 | 114,472 | 116,105 | |||
| Short-term | F31 | 18,466 | 10,895 | 12,514 | 7,203 | 2,061 | 728 | 724 | 3,777 | 3,497 | 4,023 | 5,043 | 2,535 | 4,959 | 5,562 | 4,102 | 2,389 | 2,490 | 3,477 | |||
| Long-term | F32 | 81,192 | 85,096 | 89,215 | 89,114 | 89,411 | 89,003 | 95,517 | 90,224 | 84,179 | 80,905 | 85,365 | 84,750 | 119,607 | 114,863 | 114,168 | 110,270 | 111,983 | 112,627 | |||
| Loans | F4 | 13,469 | 15,765 | 24,464 | 34,138 | 49,533 | 54,139 | 29,450 | 37,723 | 47,461 | 52,879 | 58,458 | 60,849 | 62,339 | 66,217 | 68,093 | 71,534 | 72,079 | 72,025 | |||
| Short-term | F41 | 773 | 490 | 342 | 735 | 691 | 516 | 436 | 569 | 580 | 1,838 | 2,246 | 1,907 | 1,856 | 1,460 | 1,216 | 1,468 | 1,559 | 1,485 | |||
| Long-term | F42 | 12,696 | 15,274 | 24,122 | 33,403 | 48,842 | 53,623 | 29,015 | 37,154 | 46,881 | 51,042 | 56,212 | 58,942 | 60,483 | 64,758 | 66,877 | 70,066 | 70,521 | 70,540 | |||
| less EDP debt instrument assets | F2 + F3 + F4 | 46,821 | 37,538 | 39,870 | 32,874 | 42,891 | 40,987 | 58,058 | 54,876 | 55,618 | 54,573 | 63,167 | 58,445 | 63,858 | 61,009 | 60,837 | 54,588 | 53,963 | 46,765 | |||
| By category: | ||||||||||||||||||||||
| Currency and deposits | F2 | 34,719 | 27,141 | 29,369 | 19,020 | 30,632 | 32,504 | 16,633 | 18,990 | 20,758 | 21,215 | 30,898 | 25,018 | 33,590 | 31,135 | 30,680 | 23,767 | 26,083 | 25,221 | |||
| Debt securities | F3 | 8,646 | 6,923 | 7,029 | 10,114 | 8,290 | 4,374 | 7,085 | 7,920 | 8,069 | 8,021 | 7,926 | 9,470 | 8,609 | 8,487 | 8,821 | 10,450 | 10,348 | 10,444 | |||
| Short-term | F31 | 39 | 38 | 29 | 49 | 49 | 48 | 40 | 13 | 3 | 0 | 0 | 1,046 | 1,990 | 1,991 | 1,992 | 3,744 | 3,542 | 3,667 | |||
| Long-term | F32 | 8,607 | 6,885 | 7,000 | 10,065 | 8,241 | 4,326 | 7,045 | 7,907 | 8,066 | 8,021 | 7,926 | 8,424 | 6,619 | 6,496 | 6,829 | 6,706 | 6,806 | 6,777 | |||
| Loans | F4 | 3,456 | 3,474 | 3,472 | 3,740 | 3,969 | 4,109 | 34,340 | 27,966 | 26,791 | 25,337 | 24,343 | 23,957 | 21,659 | 21,387 | 21,336 | 20,371 | 17,532 | 11,100 | |||
| Short-term | F41 | 0 | 0 | 0 | 0 | 0 | 158 | 617 | 885 | 1,116 | 1,087 | 1,500 | 1,954 | 1,909 | 1,662 | 2,002 | 2,288 | 2,449 | 2,482 | |||
| Long-term | F42 | 3,456 | 3,474 | 3,472 | 3,740 | 3,969 | 3,951 | 33,723 | 27,081 | 25,675 | 24,250 | 22,843 | 22,003 | 19,750 | 19,725 | 19,334 | 18,083 | 15,083 | 8,618 | |||
| Net General Government Debt (face value) | GGNetDebt | 77,335 | 86,114 | 99,173 | 111,289 | 112,586 | 117,674 | 129,826 | 135,235 | 138,866 | 145,254 | 147,168 | 151,781 | 154,500 | 157,669 | 157,706 | 160,962 | 161,114 | 162,937 | |||
| By category: | ||||||||||||||||||||||
| Currency and deposits | F2 | -23,690 | -15,245 | -16,519 | -5,312 | -16,160 | -17,713 | 45,559 | 39,396 | 38,588 | 40,805 | 30,570 | 37,074 | -2,137 | 900 | 1,501 | 7,589 | 2,442 | -3,649 | |||
| Debt securities | F3 | 91,011 | 89,068 | 94,700 | 86,203 | 83,181 | 85,357 | 89,156 | 86,081 | 79,607 | 76,907 | 82,482 | 77,815 | 115,957 | 111,939 | 109,448 | 102,210 | 104,124 | 105,661 | |||
| Short-term | F31 | 18,427 | 10,857 | 12,485 | 7,154 | 2,012 | 680 | 684 | 3,764 | 3,494 | 4,023 | 5,043 | 1,489 | 2,969 | 3,571 | 2,110 | -1,355 | -1,052 | -190 | |||
| Long-term | F32 | 72,585 | 78,211 | 82,215 | 79,049 | 81,170 | 84,677 | 88,472 | 82,317 | 76,113 | 72,884 | 77,439 | 76,326 | 112,988 | 108,367 | 107,339 | 103,564 | 105,177 | 105,850 | |||
| Loans | F4 | 10,013 | 12,291 | 20,992 | 30,398 | 45,564 | 50,030 | -4,890 | 9,757 | 20,670 | 27,542 | 34,115 | 36,892 | 40,680 | 44,830 | 46,757 | 51,163 | 54,547 | 60,925 | |||
| Short-term | F41 | 773 | 490 | 342 | 735 | 691 | 358 | -181 | -316 | -536 | 751 | 746 | -47 | -53 | -202 | -786 | -820 | -890 | -997 | |||
| Long-term | F42 | 9,240 | 11,800 | 20,650 | 29,663 | 44,873 | 49,672 | -4,708 | 10,073 | 21,206 | 26,792 | 33,369 | 36,939 | 40,733 | 45,033 | 47,543 | 51,983 | 55,438 | 61,922 | |||
| Table 8 Reconciliation of Exchequer Balance to General Government Deficit | |||||||||||||||||||
| € million | |||||||||||||||||||
| Description | ESA2010 code | 2010 Q1 | 2010 Q2 | 2010 Q3 | 2010 Q4 | 2011 Q1 | 2011 Q2 | 2011 Q3 | 2011 Q4 | 2012 Q1 | 2012 Q2 | 2012 Q3 | 2012 Q4 | 2013 Q1 | 2013 Q2 | 2013 Q3 | 2013 Q4 | 2014 Q1 | 2014 Q2 |
| Exchequer balance | -3,942 | -4,946 | -4,488 | -5,369 | -7,066 | -3,762 | -9,831 | -4,259 | -4,263 | -5,181 | -1,691 | -3,758 | -3,695 | -2,898 | -549 | -4,361 | -2,316 | -2,622 | |
| Deduct cash inflows which do not increase financial net worth | -1 | -1 | -1 | -380 | -1 | -1 | -1 | -59 | -2 | -2 | -2 | -8 | -1,020 | -86 | -1,310 | -298 | -1,330 | -1,158 | |
| Inflows from sale or redemption of financial assets | -1 | -1 | -1 | -380 | -1 | -1 | -1 | -59 | -2 | -2 | -2 | -8 | -1,020 | -86 | -1,310 | -293 | -1,330 | -1,158 | |
| Incurrence of Exchequer liability to Central Bank for notes and coins in circulation | 0 | 0 | 0 | 0 | 0 | 0 | 0 | 0 | 0 | 0 | 0 | 0 | 0 | 0 | 0 | -5 | 0 | 0 | |
| Exclude cash outflows which do not reduce financial net worth | 0 | 0 | 0 | 650 | 2,517 | 0 | 4,530 | 288 | 250 | 1,502 | 0 | 515 | 1,117 | 409 | 28 | 763 | 1,179 | 1,097 | |
| Acquisition of financial assets | 0 | 0 | 0 | 642 | 0 | 0 | 4,530 | 288 | 250 | 1,502 | 0 | 515 | 1,117 | 396 | 28 | 763 | 1,179 | 1,084 | |
| Repayment of promissory notes notional loan principal | 0 | 0 | 0 | 0 | 2,517 | 0 | 0 | 0 | 0 | 0 | 0 | 0 | 0 | 13 | 0 | 0 | 0 | 13 | |
| Redemption of Exchequer liability to Central Bank for notes and coins in circulation | 0 | 0 | 0 | 9 | 0 | 0 | 0 | 0 | 0 | 0 | 0 | 0 | 0 | 0 | 0 | 0 | 0 | 0 | |
| Impact on financial net worth of Exchequer cash transactions | -3,942 | -4,947 | -4,489 | -5,099 | -4,550 | -3,763 | -5,302 | -4,030 | -4,014 | -3,681 | -1,692 | -3,250 | -3,598 | -2,575 | -1,832 | -3,896 | -2,467 | -2,683 | |
| Adjust for impact of non-cash revenue and disposals of non-financial asset (+) | -1,012 | -29 | 69 | 792 | -440 | -280 | 102 | 1,337 | -1,007 | -127 | -164 | 652 | -177 | -153 | 104 | 1,034 | -687 | 180 | |
| Difference between Exchequer cash tax revenue and time-adjusted Revenue Net Receipts | -177 | -31 | 69 | 121 | 233 | -280 | 49 | 553 | -311 | -202 | 69 | 259 | -123 | -198 | 249 | 225 | 3 | 129 | |
| Receipts due from EU (Agriculture grants, Cohesion Fund, ESF and ERDF) | -835 | 2 | 0 | 671 | -673 | 0 | 0 | 709 | -771 | 0 | -8 | 768 | -785 | -10 | 0 | 755 | -744 | -3 | |
| Accrual of interest due on contingent capital assets assigned to banks | 0 | 0 | 0 | 0 | 0 | 0 | 53 | 75 | 75 | 75 | -225 | 75 | 4 | 51 | -149 | 51 | 50 | 50 | |
| Licence sales | 0 | 0 | 0 | 0 | 0 | 0 | 0 | 0 | 0 | 0 | 0 | -450 | 727 | 4 | 4 | 4 | 4 | 4 | |
| Other accrued revenue | 0 | 0 | 0 | 0 | 0 | 0 | 0 | 0 | 0 | 0 | 0 | 0 | 0 | 0 | 0 | 0 | 0 | 0 | |
| Adjust for impact of non-cash expenditure (-) | -11,762 | -2,431 | -9,637 | -9,339 | 670 | 521 | -1,244 | 466 | 321 | 678 | -1,272 | 55 | 44 | 727 | -1,333 | 750 | -277 | 472 | |
| Capital transfers to financial institutions financed by promissory notes | -10,900 | -2,250 | -8,580 | -9,120 | 0 | 0 | 0 | 0 | 0 | 0 | 0 | 0 | 0 | 13 | 0 | 0 | 0 | 13 | |
| Difference between interest paid and accrued | -213 | 457 | -1,186 | -332 | 647 | 485 | -1,279 | 293 | 329 | 676 | -1,275 | 57 | -36 | 669 | -1,376 | 821 | 140 | 520 | |
| Difference between Exchequer cash issues and accrued net spending of departments and offices | 85 | 83 | 82 | 68 | -9 | -9 | -9 | 129 | -44 | -42 | -40 | -7 | 18 | 18 | 17 | -57 | -78 | -78 | |
| Other accrued expenditure | -734 | -722 | 46 | 45 | 32 | 45 | 44 | 44 | 36 | 44 | 43 | 6 | 62 | 27 | 26 | -14 | -340 | 16 | |
| Surplus/Deficit of Exchequer | B9_exchequer | -16,716 | -7,407 | -14,058 | -13,646 | -4,320 | -3,523 | -6,444 | -2,227 | -4,701 | -3,130 | -3,129 | -2,543 | -3,731 | -2,002 | -3,060 | -2,113 | -3,431 | -2,031 |
| Surplus/Deficit of extra-budgetary bodies, funds and accounts consolidated with Exchequer | -449 | 86 | -77 | 127 | -204 | -56 | -324 | 318 | 137 | 51 | -46 | 4 | 48 | -87 | -7 | -60 | 152 | 63 | |
| Social Insurance Fund | -528 | -283 | -115 | 95 | -104 | -22 | -45 | -21 | 50 | -29 | -44 | 22 | 74 | -34 | -28 | -15 | 92 | 0 | |
| Bank Guarantee Scheme receipts - special account | 0 | 297 | 0 | -556 | 313 | -223 | -373 | 280 | -20 | -12 | -25 | -10 | -16 | -116 | -25 | -10 | -11 | -5 | |
| Capital Services Redemption Account | 3 | 14 | 5 | 578 | -577 | 53 | -26 | -49 | 30 | 37 | -18 | -50 | 23 | 35 | 9 | -67 | 25 | 28 | |
| Small Savings Reserve Fund | 0 | 0 | 0 | 0 | 0 | 0 | 0 | 0 | 0 | 0 | 0 | 0 | 0 | 0 | 0 | 0 | 0 | 0 | |
| Other Extra-Budgetary Funds | 35 | 18 | -6 | -36 | 130 | 102 | 84 | 58 | 104 | 79 | 63 | 50 | -35 | 25 | 35 | 30 | 46 | 40 | |
| Health Service Executive | 41 | 40 | 39 | 46 | 34 | 35 | 36 | 50 | -26 | -25 | -23 | -9 | 3 | 3 | 3 | 3 | 0 | 0 | |
| Surplus/Deficit of Budgetary Central Government | B9_bcg | -17,165 | -7,321 | -14,135 | -13,519 | -4,523 | -3,579 | -6,768 | -1,909 | -4,563 | -3,078 | -3,175 | -2,539 | -3,683 | -2,089 | -3,067 | -2,173 | -3,279 | -1,969 |
| Surplus/Deficit of other Central Government bodies | 235 | 1,300 | 506 | -3,453 | 157 | 233 | -4,231 | -925 | -6 | -506 | 32 | 29 | 311 | 235 | 201 | 254 | 228 | 164 | |
| National Pensions Reserve Fund | 164 | 1,228 | 433 | -3,527 | 162 | 235 | -4,042 | -728 | 180 | -199 | 153 | 200 | 112 | 181 | 146 | 154 | 90 | 119 | |
| Non-market State corporations and agencies | 72 | 72 | 72 | 72 | 0 | 1 | -188 | -197 | -187 | -307 | -122 | -163 | 193 | 46 | 49 | 93 | 139 | 44 | |
| Voluntary and joint board hospitals | -1 | 0 | 1 | 2 | -5 | -3 | -1 | 0 | 1 | 1 | 0 | -9 | 7 | 7 | 7 | 7 | 0 | 0 | |
| Surplus/Deficit of Central Government | B9_S1311 | -16,930 | -6,021 | -13,629 | -16,972 | -4,367 | -3,346 | -10,999 | -2,834 | -4,569 | -3,584 | -3,144 | -2,511 | -3,372 | -1,855 | -2,866 | -1,918 | -3,051 | -1,805 |
| Surplus/Deficit of Local Government | B9_S1313 | 382 | -171 | -92 | -34 | 93 | -81 | 56 | -111 | 109 | -111 | -42 | -48 | 82 | -21 | 12 | -29 | -32 | 29 |
| Surplus/Deficit of General Government | B9_S13 | -16,548 | -6,192 | -13,721 | -17,006 | -4,274 | -3,426 | -10,943 | -2,945 | -4,461 | -3,695 | -3,186 | -2,559 | -3,289 | -1,876 | -2,854 | -1,947 | -3,082 | -1,776 |
Introduction
The figures in this release comprise the quarterly Government Finance Statistics results under the new standards for National Accounts (ESA 2010).
National accounts are compiled in the EU according to the European System of National and Regional Accounts (ESA) framework. In 2014, the new ESA 2010 framework replaced the previous ESA 95 version and all EU member states were required to adopt ESA 2010 by September 2014. Quarterly Government Finance Statistics were published for the first time according to the new standard in July of this year.
The data published in this series are consistent with the General Government Deficit and Debt levels reported at end-September under the EU regulation governing the Excessive Deficit Procedure. Consequently they may not always be fully aligned with the National Income and Expenditure and related publications such as the Institutional Sector Accounts.
Impact of ESA 2010
The impact of ESA 2010 can be seen in the overall deficit and debt figures and also on the components of these two measures. Changes which impact on debt and deficit can be broken into three categories:
Sector classification changes
The classification change under ESA 2010 with a material debt/deficit impact is the classification of Irish Bank Resolution Corporation (IBRC) in the General Government sector with effect from mid-2011. This results from a technical change from the ESA 95 standard where entities that were classified as Monetary Financial Institutions were by definition excluded from the General Government sector. This automatic exclusion no longer applies under ESA 2010 - see http://epp.eurostat.ec.europa.eu/portal/page/portal/government_finance_statistics/documents/IE-Classification_Irish_Bank_Resolution_Corp-ESA2010.pdf.
The reclassification applies from the date of the merger of Anglo Irish Bank and Irish Nationwide Building Society on 1 July 2011. This event took place following approval by the European Commission of a joint restructuring plan for Anglo Irish Bank and Irish Nationwide Building Society, which required the merger of the banks, the sale of their deposit books, and the orderly work-out of the merged loan book over a period not to exceed 10 years (see http://europa.eu/rapid/press-release_IP-11-801_en.htm).
Impact of reclassification on deficit
|
|
2011 |
2012
|
2013
|
|
GG Deficit impact (% of GDP; - implies deficit is worsened in period, + implies deficit improvement) |
-0.2 |
-0.4 |
0.7 |
Impact of reclassification on debt
|
|
Q4 2011 |
Q4 2012 |
Q4 2013 |
|
GG Gross Debt impact (% of GDP; + implies debt increase ) |
12.2 |
10.3 |
7.2 |
|
GG Net Debt impact (% of GDP; + implies debt increase) |
-1.8 |
-0.2 |
-0.4 |
IBRC’s own surplus/deficit for all periods since Q3 2011 is now included in the line“Non-market State corporations and agencies” in Table 8 of this release. In ESA 2010 the payments under the Eligible Liabilities Guarantee Scheme arising from the liquidation of IBRC are treated as intra-government transfers rather than government expenditure resulting in the improved deficit position for 2013 compared to that reported under ESA 95.
Transfer of pension obligations to government
Under ESA 95, when government assumed the pension liabilities of the pension fund of a corporation the transfer of assets of the fund at the time of the transfer to government was treated as a lump sum payment which contributed to government revenue for the period in which the transfer took place and therefore improved the deficit for the period. Under ESA 2010, in the case where the assets and liabilities of the funded pension scheme are equal, such a transfer is now treated as a financial transaction with no impact on the government deficit. In the case where the liabilities exceed the assets of the scheme, the deficit is now worsened by the difference in the assets and liabilities at the time of the transfer. An accounts payable liability is recorded in the government accounts at the time of the transfer and as cash payments are made in future periods this liability decreases accordingly. In the years following the transfer the impact on the deficit is neutral with an imputed revenue offsetting the expenditure incurred.
The impact of this on the Irish accounts can be seen in 2009 and 2010, at which time Government assumed responsibility for the pension schemes of the universities and of a number of semi-state bodies. Under ESA 95 the transfer of these assets had a positive impact on the deficit in the relevant years (as outlined above). Under ESA 2010 this impact is now reversed, and an additional deficit impact reflecting the difference between the assets and liabilities of these schemes is included in the revised deficit figures.
|
Treatment of lump-sum payment on transfer of assets & liabilities of pension scheme to government – impact on GG Surplus / Deficit (€bn) |
2009 |
2010 |
|
ESA 95 |
+0.6 |
+1.1 |
|
ESA 2010 |
-0.4 |
-0.4 |
|
Change in previously recorded surplus/deficit |
-1.0 |
-1.5 |
In later years the imputed revenue results in a small deficit improvement under ESA 2010 when compared with the recording under ESA 95 which reflected the expenditure incurred but no imputed revenue for those years.
Treatment of 2010 AIB capital injection
The 2010 deficit has been revised in the amount of €3,818 million, resulting from a re-examination of the treatment of an injection of €3,700 million made by the Irish Government through the NPRF in 2010. At the time this injection was recorded as a financial transaction, namely the acquisition of equity in AIB, with no impact on the GG Deficit. Subsequently, during 2011, this shareholding was devalued to zero, again with no impact on the deficit, as revaluations do not impact the deficit.
As part of the ESA 2010 transition, a review of Government transactions related to the financial crisis has been undertaken. The CSO has determined, in consultation with Eurostat, that due to the timing of the devaluation of the AIB shareholding, it would be correct to re-classify this injection (along with the reinvestment of a further €118 million of fees and other income related to this shareholding which had also been treated initially as a financial transaction) as a capital transfer, impacting the deficit in 2010. The total change to the 2010 deficit, therefore, is to worsen it by €3,818 million or 2.3% of GDP.
Changes in the treatment of interest on swaps and forward rate agreements
Under ESA 95 the government deficit data related to the EDP (EDP B.9) differed from the deficit according to ESA95 (B.9) by the inclusion in the interest calculation of flows relating to swaps and forward rate agreements. This difference is now eliminated under ESA 2010 with the EDP concept of interest being aligned with the ESA concept – i.e. no adjustment for swaps.
The item Net derivative flows on debt interest swap contracts continues to be shown in Table 1 of this release as a memorandum item.
ESA 2010 changes not affecting deficit and debt levels:
Recording of payable tax credits
Payable tax credits arise where (i) a tax credit can be awarded to non-taxpayers as well as to tax payers or (ii) where the tax relief to taxpayers exceeds their liability and the beneficiary receives the excess.
Under ESA 95 tax revenues were reported net of these amounts. Under ESA 2010 the amounts of these payable tax credits must now be recorded as part of gross tax revenues and a corresponding expenditure must also be recorded. There is consequently an increase in both total revenue and total expenditure with no impact on the GG Surplus/Deficit.
In Ireland there are currently two tax credits which fall into this category – mortgage interest relief and health insurance relief. The payment of a ‘top-up’ of 25% of the total deposit to holders of Special Incentive Savings and Investment Scheme (SSIA) accounts under the conditions set out in the scheme are also recorded as payable tax credits for the relevant period as are those relating to the interim Health Insurance Levy (age related) which applied from 2009 to 2012.
Other changes
The value of the stock of non-financial assets of General Government has been revised upwards since previous results. This has mainly resulted from the classification of Local Authority housing stock to the Government sector which had previously been allocated to the household sector (S.14). This revision has had a significant effect on the net worth figure previously reported. It should be noted that this measure is currently published by relatively few countries. The CSO introduced the concept of net worth to our GFS publication at the outset on an experimental basis and have continued to work to improve this estimate.
Institutes of Technology have been re-classified from the Local Government sub-sector to Central Government. These institutes had originally been classified within Local Government due to their historic relationship with the VECs. The reclassification is due to the direct relationship that now exists between the IoTs and the Higher Education Authority which is part of Central Government. There is no impact of the General Government debt or deficit as a result of this reclassification, the impact is seen only at sub-sector level. The IoTs are included within the line “Non-market State corporations and agencies” in Table 8 of this release.
Following a review by the CSO it has been determined that the Social Insurance Fund should not be classified as separate subsector of Government but should be included within the Central Government subsector. This change has been implemented with retrospective effect to the entire GFS data series. Details of the rational for the reclassification can be seen in the CSO Register of Public Sector Bodies at:
http://www.cso.ie/en/surveysandmethodology/nationalaccounts/
Revisions to GDP
The GDP figures used in the current publication are consistent with those published in the National Income and Expenditures and Quarterly National Accounts releases, and reflect the increased GDP levels arising from the adoption of ESA 2010.
Pension Liabilities
The estimated pension liability of government (the accrued liability in respect of Public Service occupational pensions) is a contingent liability of government and does not form part of the ESA accounts of general government. It is shown in this release as a memorandum item. The value shown for years 2009-2011 of €116 billion was calculated by the Comptroller and Auditor General. The value of this liability is reduced by €18 billion to €98 billion with effect from 2012. This follows an actuarial valuation carried out by the Department of Public Expenditure and Reform. The main reasons for the reduction were the pay and pension cuts since 2009 and the freeze in pay and pension rates until after the Haddington Road Agreement. Details on this updated estimate can be accessed at: http://www.per.gov.ie/public-service-pensions-accrued-liability/.
Government Finance Statistics – Concepts and Definitions
Government Finance Statistics (GFS) form the basis for fiscal monitoring in Europe, in particular in relation to the Excessive Deficit Procedure (EDP).
European GFS, including EDP statistics are currently produced according to the legally binding accounting rules of the European System of Accounts 1995 (ESA95). The new ESA 2010 standard on which the data in this release are based came into force in September 2014. The Manual on Government Debt and Deficit (MGDD) provides further guidance on the implementation of ESA95 / ESA 2010 in the context of GFS.
EU Member States are required to report government deficit/surplus and debt data biannually under the EDP (before 1 April and 1 October in year N) for years N-4 to N-1 calendar years as well as a forecast for the current year. The data are reported in harmonised tables, which provide a consistent framework for the presentation of this data by Member States. The tables provide a structure for linking national budgetary aggregates with government deficit and debt.
Detailed statistics on Government revenue and expenditure are also provided to Eurostat under the ESA transmission programme. These data are available on the Eurostat website.
Definition of general government and its subsectors
The general government sector of the economy, is defined in ESA2010 paragraph 2.111: as “institutional units which are non-market producers whose output is intended for individual and collective consumption, and are financed by compulsory payments made by units belonging to other sectors, and institutional units principally engaged in the redistribution of national income and wealth.” General government comprises the sub-sectors central government (S.1311), state government (S.1312 – which does not apply in Ireland), local government (S.1313), and social security funds (S.1314).
As part of the GFS production process the CSO is required to define the General Government and public sectors for Ireland. In this context, the public sector includes all bodies that are directly or indirectly controlled by a Government department or office, or by a local authority. General Government, in turn, includes all public sector bodies that are also mainly financed by Government bodies. The decision rules governing the classification of bodies to the public and General Government sectors are set out in detail in the Manual on Government Deficit and Debt. A detailed explanation of the application of these rules and the most up-to-date list (reference year 2013) of public sector bodies (including general government bodies) for Ireland are shown at:
http://www.cso.ie/en/surveysandmethodology/nationalaccounts/.
General Government Deficit/Surplus (GG Deficit/Surplus) is the standard European measure of the fiscal balance, which is used to monitor compliance with the Stability and Growth Pact.
This measure is by definition equal to both Total Revenue (TR) less Total Expenditure (TE), and Net Acquisition of Financial Assets less Net Incurrence of Liabilities. In order to respect this accounting identity, a technical adjustment is made to the level of transactions recorded in liability category F32 (long-term debt securities) to eliminate any statistical discrepancy between the two approaches to the calculation of GG Deficit/Surplus. This adjustment has no impact on gross debt, net debt or net worth.
General Government Gross Debt (GG Debt) is defined in the EU regulations implementing the Maastricht Treaty as the gross debt liabilities of the consolidated General Government sector, at nominal value.
‘Gross’ means that the value of any financial assets held by General Government cannot be deducted from the GG Debt. In Ireland’s case, this means that the liquid assets which are deducted from the ‘gross’ National Debt in arriving at the audited National Debt cannot be deducted from the GG Debt.
‘Debt liabilities’ are defined as the ESA 2010 categories AF.2 (Currency and Deposits), AF.3 (Debt Securities), and AF.4 (Loans).
This definition excludes liabilities in derivatives, equity liabilities, pension and insurance liabilities and accounts payable.
‘Consolidated’ means that any money owed by one entity within General Government to another is
excluded from the total GG Debt.
‘Nominal value’ is defined in the governing regulation as face value. If debt is sold at a discount, it is the undiscounted value of the instrument, rather than the amount actually received, that is shown in the GG Debt. In other statistical contexts, ‘nominal value’ means face value plus any interest accrued but not paid; however, such interest is excluded from GG Debt by definition.
There is no change in the definition of GGDebt under ESA 2010.
General Government Net Debt is a measure produced in accordance with the methodology of the IMF/World Bank Public Sector Debt Statistics Guide, by subtracting from the GG Gross Debt figure the value of the financial assets corresponding to the categories of financial liabilities which comprise GG Gross Debt.
General Government Net Worth is calculated as the sum of financial and non-financial assets of General Government less financial liabilities.
Detailed codes and technical definitions can be seen in the ESA 2010 manual available at http://epp.eurostat.ec.europa.eu/portal/page/portal/esa_2010/introduction . A listing of some of the main items included in this release is shown below
Main Components of General Government Expenditure and Revenue
P.2 Intermediate consumption – value of goods and services used in the process of production, excluding fixed assets
P.5 Gross capital formation
P.51g Gross fixed capital formation - acquisitions, less disposals, of fixed assets during a given period plus certain additions to the value of non-produced assets realised by productive activity. Fixed assets are tangible or intangible assets produced as outputs from processes of production that are themselves used repeatedly, or continuously, in processes of production for more than one year
P.51c Consumption of fixed capital - the amount of fixed assets used up, during the period under consideration, as a result of normal wear and tear and foreseeable obsolescence, including a provision for losses of fixed assets as a result of accidental damage which can be insured against.
P.52 Changes in inventories
P.53 Acquisitions less disposals of valuables
D.1 Compensation of employees – the total remuneration of government employees
D.29 Other taxes on production (payable) all taxes that enterprises incur as a result of engaging in production, independently of the quantity or value of the goods and services produced or sold. These include taxes on use or ownership of land or buildings, taxes on use of fixed assets, taxes on total wage bill and payroll, taxes on international transactions related to production.
D.3 Subsidies (payable) - current unrequited payments which general government or the institutions of the European Union make to resident producers, with the objective of influencing their levels of production, their prices or the remuneration of the factors of production
D.4 Property income accrues when the owners of financial assets and natural resources put them at the disposal of other units of the economy. The income payable for the use of financial assets is called investment income, while that payable for the use of a natural resource is called rent. Property income is the sum of investment income and rent.
D.41 Interest receivable by the owners of a financial asset for putting it at the disposal of another institutional unit. Applies to deposits (AF.2), debt securities (AF.3), loans (AF.4) and other accounts payable (AF.8)
D.5 Current taxes on income, wealth, etc, (payable) - all compulsory, unrequited payments, in cash or in kind, levied periodically by general government and by the rest of the world on the income and wealth of units in the economy, and some periodic taxes which are assessed neither on income nor wealth
D.6 Social contributions - transfers to households, in cash or in kind, intended to relieve them from the financial burden of a number of risks or needs.
D.7 Other current transfers – includes VAT and GNI based EU budget contributions, current transfers between subsectors of government, current international co-operation and current transfers to households and non-profit institutions.
D.9 Capital transfers - involve the acquisition or disposal of an asset, or assets, by at least one of the parties to the transaction. Includes capital taxes and investment grants.
Categories of Financial Flows
F.1 Monetary gold and special drawing rights (SDRs)
F.11 Monetary gold
F.12 Special drawing rights (SDRs)
F.2 Currency and deposits
F.21 Currency
F.22 Transferable deposits
F.29 Other deposits
F.3 Debt securities
F.31 Short-term
F.32 Long-term
F.4 Loans
F.41 - Short-term loans
F.42 - Long-term loans
F.5 Equity and investment fund shares
F.51 Equity
F.52 Investment fund shares/units
F.6 Insurance pension and standardised guarantee schemes
F.7 Financial derivatives and employee stock options
F.71 Financial derivatives
F.72 Employee stock options
F.8 Other accounts receivable/payable
F.81 Trade credits and advances
F.89 Other
 Hide Background Notes
Scan the QR code below to view this release online or go to
http://www.cso.ie/en/releasesandpublications/er/gfsq/governmentfinancestatisticsquarter22014/
 Show Table 1 General Government Transactions: Revenue, Expenditure, Financing and Deficit Q1 2010 to Q2 2014
 Hide Table 1 General Government Transactions: Revenue, Expenditure, Financing and Deficit Q1 2010 to Q2 2014